. 2000 Nov 1;19(21):5824-34.
doi: 10.1093/emboj/19.21.5824.

A protein complex containing Tho2, Hpr1, Mft1 and a novel protein, Thp2, connects transcription elongation with mitotic recombination in Saccharomyces cerevisiae

Affiliations

A protein complex containing Tho2, Hpr1, Mft1 and a novel protein, Thp2, connects transcription elongation with mitotic recombination in Saccharomyces cerevisiae

S Chávez et al. EMBO J. .

Abstract

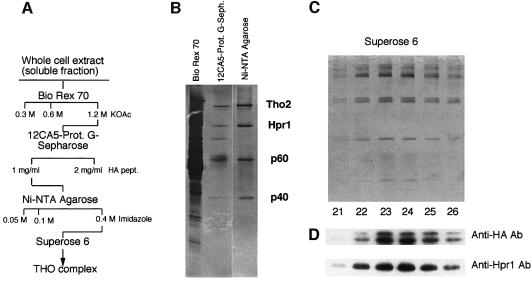
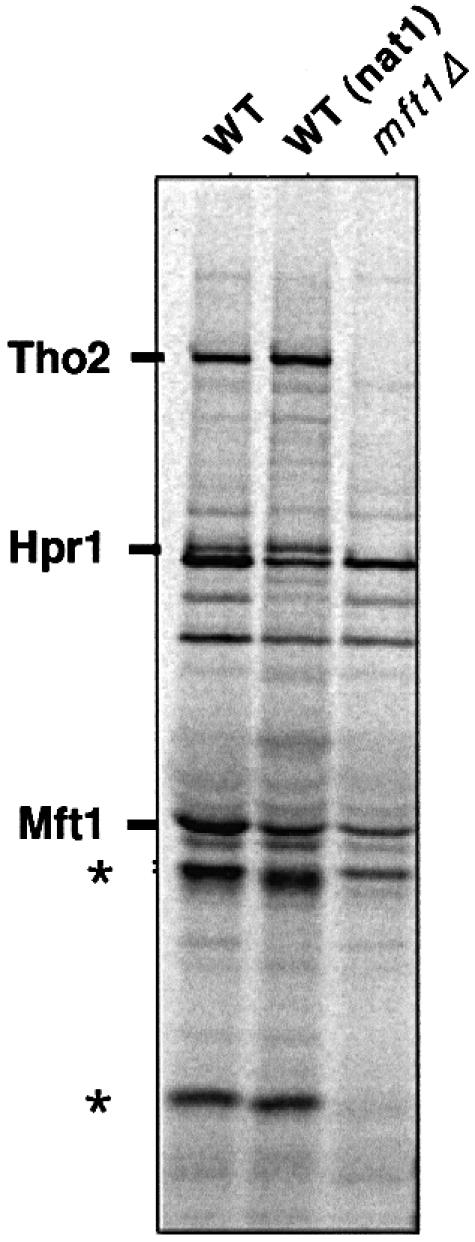
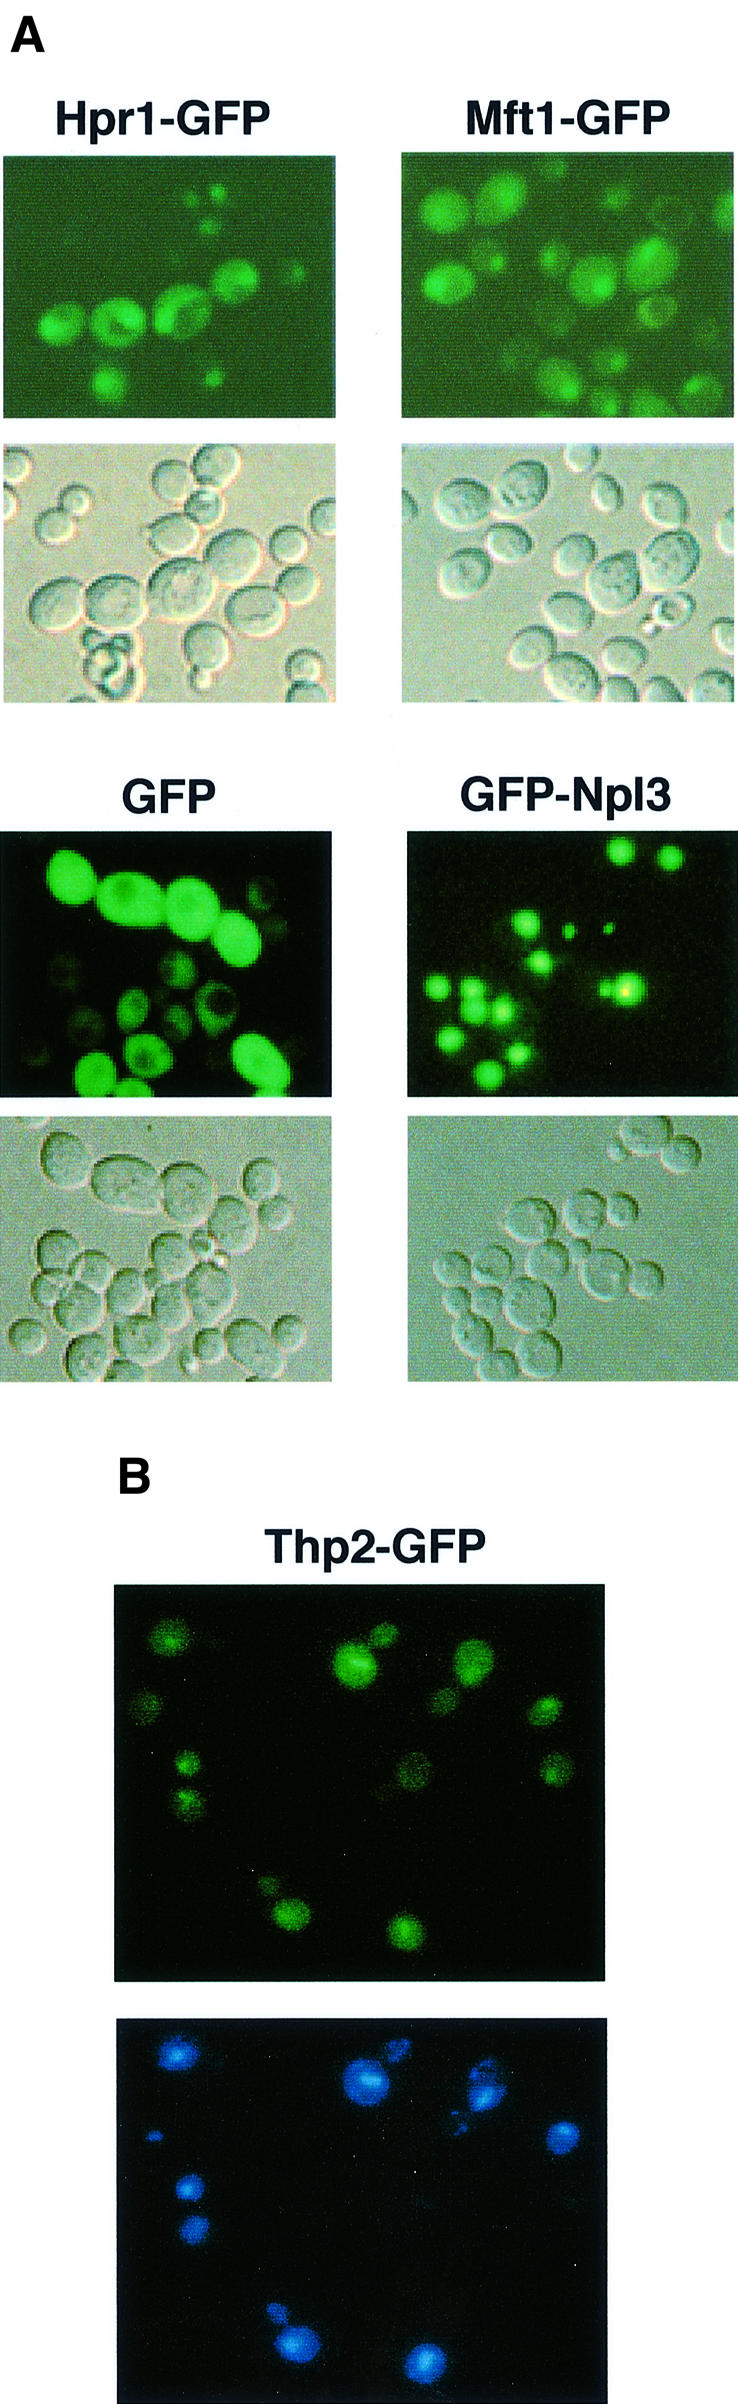
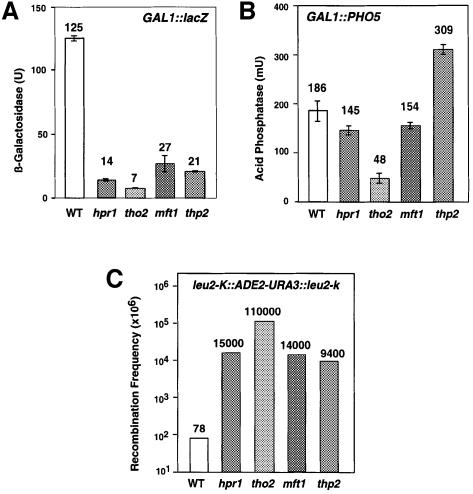
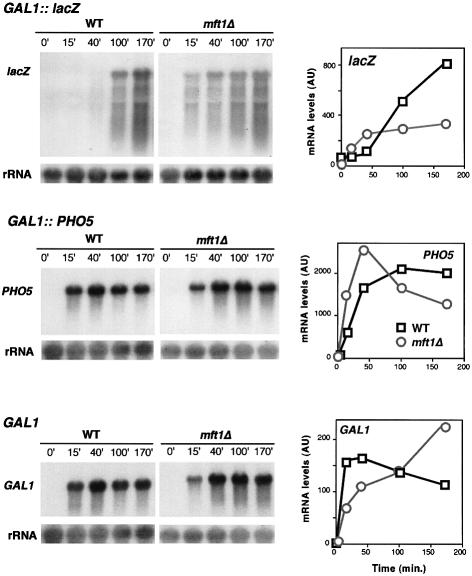
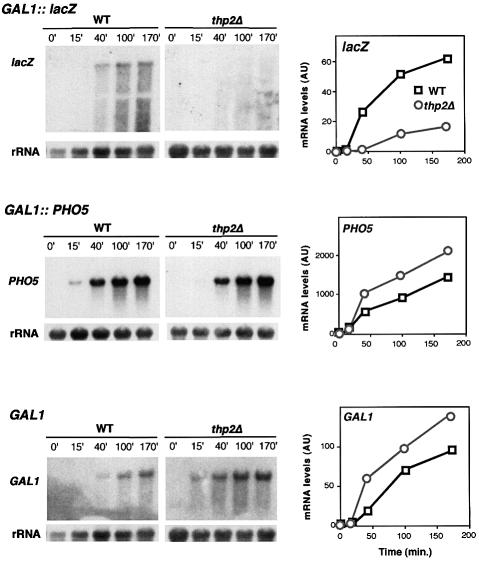
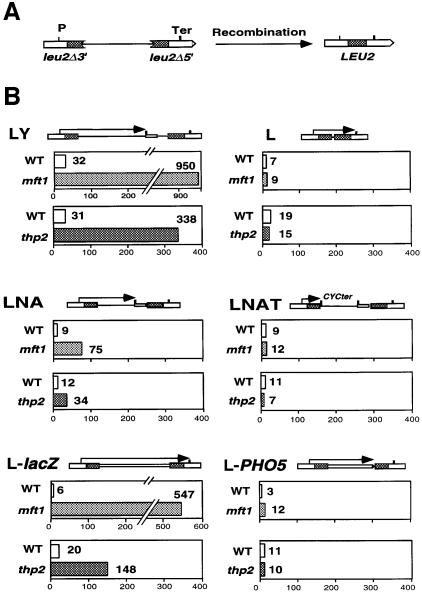
Transcription-induced recombination has been reported in all organisms from bacteria to mammals. We have shown previously that the yeast genes HPR1 and THO2 may be keys to the understanding of transcription-associated recombination, as they both affect transcription elongation and hyper-recombination in a concerted manner. Using a yeast strain that has the wild-type THO2 gene replaced by one encoding a His(6)-HA-tagged version, we have isolated an oligomeric complex containing four proteins: Tho2, Hpr1, Mft1 and a novel protein that we have named Thp2. We have reciprocally identified a complex containing Hpr1, Tho2 and Mft1 using anti-Mft1 antibodies in immunoprecipitation experiments. The protein complex is mainly nuclear; therefore, Tho2 and Hpr1 are physically associated. Like hpr1Delta and tho2Delta cells, mft1Delta and thp2Delta cells show mitotic hyper- recombination and impaired transcription elongation, in particular, through the bacterial lacZ sequence. Hyper-recombination conferred by mft1Delta and thp2Delta is only observed in DNA regions under transcription conditions. We propose that this protein complex acts as a functional unit connecting transcription elongation with the incidence of mitotic recombination.


Figures

None
Fig. 1. (A) Schematic diagram used for the purification of the THO complex. (B) SDS–polyacrylamide gels of the 1.2 M KOAc eluates from Bio-Rex70, the 2 mg/ml HA-peptide eluate from 12CA5-protein G–Sepharose fraction and the 0.4 M imidazole eluate from the Ni-NTA agarose mix. (C) SDS–PAGE of fractions 21–26 obtained after gel filtration through a Superose 6 PC3.2/30 column. (D) Western blots of the SDS–PAGE gels using anti-HA and Anti-Hpr1 antibodies (see text for details).
None
Fig. 2. Tho2 and Hpr1 are co-immunoprecipitated with a monoclonal anti-Mft1. Cell extracts were prepared from either wild-type (JK9-3da and nat1) or mft1Δ strains of yeast metabolically labeled with [35S]methionine, and then subjected to immunoprecipitation with the monoclonal antibody P1A12H8. Immunoprecipitated proteins were analyzed by SDS–PAGE and phosphoimaging. After transfer to PVDF membranes, the bands indicated on the gels were identified as Tho2 and Hpr1. Mft1 migrates close to the IgG heavy chain and is compressed together with several minor endogeous proteins by the immunoglobulin heavy chains during SDS–PAGE. The minor endogenous proteins are still visible in the mft1Δ lane. Mft1 is subject to some proteolytic degradation during the course of the experiment. Proteolytic fragments of Mft1 (indicated with an asterisk) have been characterized previously (Cartwright et al., 1997).
None
Fig. 3. The N-terminal domain of Mft1 is required to form an oligomeric particle. Extracts were prepared from yeast cells expressing GST–Mft1(Δ189–392) and subjected to sucrose density gradient centrifugation. Fractions were collected from the sucrose density gradients and analyzed by SDS–PAGE and immunoblotting with antibodies recognizing Mft1 and ribosomal protein L3. Also shown are equivalent fractions of sucrose density gradient analysis from extracts of tho2Δ yeast cells expressing the GST–Mft1(Δ189–392) fusion protein.
None
Fig. 4. Subcellular colocalization of Mft1, Hpr1 and Thp2. (A) Diploid JK9 cells were transformed with plasmids encoding Mft1–GFP, Hpr1–GFP, GFP and GFP–Npl3, and analyzed by fluorescence microscopy to visualize GFP fusions (top) and with Nomarski optics to visualize whole cells (bottom). (B) Haploid strain BY-HR167 was transformed with plasmids encoding Thp2-GFP and analyzed by fluorescence microscopy to visualize either GFP (top) and nuclei (bottom) after DAPI staining. Although only localization of Thp2–GFP expressed from plasmid pUG23 is shown, identical results were obtained for the GFP–Thp2 fusion expressed from pUG34 (data not shown).
None
Fig. 5. Effect of the mft1Δ and thp2Δ mutations on gene expression and recombination. β-galactosidase (A) and acid phosphatase (B) activities of wild-type (W303–1A) and mutant strains mft1Δ (WMK-1A), and thp2Δ (BY-HR167) transformed with centromeric plasmid p416GAL1-lacZ and pSCh202 containing lacZ and PHO5 under the GAL1 promoter, respectively. Average value and standard deviation of two different transformants are shown for each strain. Only data of induced expression are given (2% galactose). Under repressed conditions (2% glucose), values were 1–2 U and 4–8 mU for β-galactosidase and acid phosphatase, respectively. (C) Frequency of recombination of the chromosomal direct repeat system leu2-k::ADE2-URA3::leu2-k wild type (wt) and mutant strains mft1Δ (YTW-13C) and thp2Δ (HRW167–18D). Data from hpr1Δ and tho2Δ strains are taken from Piruat and Aguilera (1998) and correspond to W303 isogenic strains. Similar results for recombination were obtained for strains SEW-2C and SEW-14B (wild type), SEW-2D (mft1-ts), YTW-5A (mft1Δ) or HRW167–12D and HRW167–16A (thp2Δ).
None
Fig. 6. Transcription analysis of GAL1-lacZ, GAL1-PHO5 and endogenous GAL1 gene in wild-type and mft1Δ cells. Northern blot analyses of lacZ and PHO5 mRNAs driven from the GAL1 promoter in the strains W303–1A (WT) and WMK-1A (mft1Δ) transformed with plasmids p416GAL1lacZ and pSCh202 are shown. Mid-log phase cells were diluted in 3% glycerol–2% lactate SC-ura and diluted into identical fresh media to an OD600 of 0.5 and incubated for 16 h. Galactose (Gal) was then added and samples were taken for northern blot analysis at different times, as specified. DNA probes used were the 3 kb BamHI–BamHI 5′ end fragment of lacZ, a 0.9 kb EcoRV–EcoRV PHO5 internal fragment, a 0.75 kb PvuII–AvaI GAL1 internal fragment and a 589 bp 28S rRNA internal fragment obtained by PCR (rRNA). The kinetics of induction of mRNAs as determined by quantification of northern blots in a Fuji FLA3000 are shown. The mRNA values are given in arbitrary units (AU) with respect to rRNA levels.
None
Fig. 7. Transcription analysis of GAL1-lacZ, GAL1-PHO5 and the endogenous GAL1 gene in wild-type (BY4741) and thp2Δ cells (BY-HR167). Other details are as in the legend to Figure 6.
None
Fig. 8. Recombination analysis of direct repeat systems in wild-type (WT), mft1Δ and thp2Δ strains. (A) Scheme of the deletion resulting from recombination between the direct repeats used. (B) Recombination frequencies were determined in strains SEY2102 (WT) and Mft1(m6) (mft1) transformed with plasmid pRS314-LYΔNS (LYΔNS) or pRS314-L (L); strains BY4741 (WT) and BY-HR167 (thp2) transformed with pRS314-LY (LY) or pRS314-L (L); strains SEW-14D (WT) and SEW-14C (mft1) or HRW167–18Bu (WT) and HRW167-16Au (thp2) transformed with pRS314-LNA (LNA) or pRS314-LNAT (LNAT); and strains W303-1A (WT) and WMK-1A (mft1) or HRW167-18Bu (WT) and HRW167-18Du (thp2) transformed with pSCh204 (L-lacZ) or pSCh206 (L-PHO5). In the scheme of each repeat system, the transcripts driven from the external LEU2 promoter are indicated by arrows. For fluctuation tests, colonies were obtained from SC-Trp with 2% glucose and recombinants selected in SC-Leu-Trp. The median frequency of 6–12 cultures is given in each case.

References

    1. Aguilera A. and Klein,H.L. (1988) Genetic control of intrachromosomal recombination in Saccharomyces cerevisiae. I. Isolation and genetic characterization of hyper-recombination mutations. Genetics, 119, 779–790. - PMC - PubMed
    1. Aguilera A. and Klein,H.L. (1990) HPR1, a novel yeast gene that prevents intrachromosomal excision recombination, shows carboxy-terminal homology to the Saccharomyces cerevisiae TOP1 gene. Mol. Cell. Biol., 10, 1439–1451. - PMC - PubMed
    1. Bedwell D.M., Klionsky,D.J. and Emr,S.D. (1987) The yeast F1-ATPase beta subunit precursor contains functionally redundant mitochondrial protein import information. Mol. Cell. Biol., 7, 4038–4047. - PMC - PubMed
    1. Beilharz T., Beddoe,T., Landl,K., Cartwright,P. and Lithgow,T. (1997) The protein encoded by the MFT1 gene is a targeting factor for mitochondrial precursor proteins and not a core ribosomal protein. FEBS Lett., 407, 220–224. - PubMed
    1. Blackwell T.K., Moore,M.W., Yancopoulos,G.D., Suh,H., Lutzker,S., Selsing,E. and Alt,F.W. (1986) Recombination between immunoglobulin variable region gene segments is enhanced by transcription. Nature, 324, 585–589. - PubMed

Publication types

MeSH terms