

Improved version 2.0 qualitative and quantitative AMPLICOR reverse transcription-PCR tests for hepatitis C virus RNA: calibration to international units, enhanced genotype reactivity, and performance characteristics
- PMID: 11060086
- PMCID: PMC87559
- DOI: 10.1128/JCM.38.11.4171-4179.2000
Improved version 2.0 qualitative and quantitative AMPLICOR reverse transcription-PCR tests for hepatitis C virus RNA: calibration to international units, enhanced genotype reactivity, and performance characteristics
Abstract
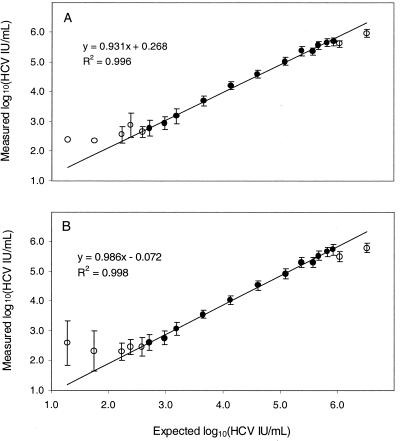
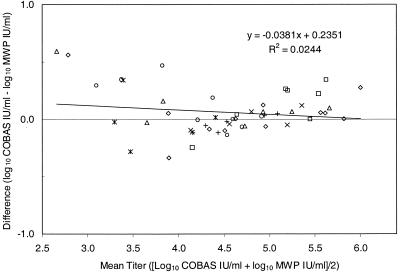
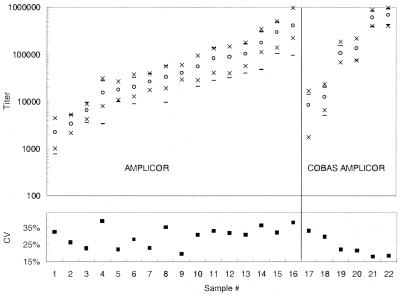
Version 2.0 qualitative and quantitative AMPLICOR reverse transcription-PCR tests for HCV were designed to improve on the performance of first version of the hepatitis C virus (HCV) tests. The new tests were calibrated in international units, the new commonly accepted standard unit of measurement for HCV RNA. The sensitivity of the qualitative tests was enhanced by modifying the specimen processing procedure to achieve a limit of detection 50 IU/ml. The limit of detection for the quantitative tests was 600 IU/ml. Modifications to the amplification reaction mixture and thermal cycling conditions enabled all genotypes to be amplified with similar efficiency. The quantitative tests exhibited a linear range extending from 500 to 500,000 IU/ml and excellent reproducibility, with coefficients of variation ranging from 18 to 39%, within the linear range. These data indicate that the version 2. 0 AMPLICOR HCV tests will improve diagnosis of HCV infection and will yield more-accurate titers for prognosis and for monitoring therapeutic efficacy, particularly at low viral loads. Furthermore, it will be possible to compare the performance characteristics and viral load measurements of AMPLICOR tests to those of other tests that adopt the international unit as the standard of measurement.
Figures
References
-
- Bland J M, Altman D J. Regression analysis. Lancet. 1986;i:908–909. - PubMed
-
- Bonetti P, Chemello L, Antona C, Breda A, Brosolo P, Casarin P, Crivellaro C, Dona G, Martinelli S, Rinaldi R, Zennaro V, Santonastaso M, Urban F, Pontisso P, Alberti A. Treatment of chronic hepatitis C with interferon-alpha by monitoring the response according to viraemia. J Viral Hepat. 1997;4:107–112. - PubMed
-
- Charlton M, Seaberg E, Wiesner R, Everhart J, Zetterman R, Lake J, Detre K, Hoofnagle J. Predictors of patient and graft survival following liver transplantation for hepatitis C. Hepatology. 1998;28:823–830. - PubMed
-
- Davis G L, Lau J Y N. Factors predictive of a beneficial response to therapy of hepatitis C. Hepatology. 1997;26(Suppl. 1):122S–127S. - PubMed
Publication types
MeSH terms
Substances
LinkOut - more resources
Full Text Sources
Medical
