. 2000 Nov 1;528(Pt 3):497-507.
doi: 10.1111/j.1469-7793.2000.00497.x.

Patch-clamp characterisation of somatostatin-secreting -cells in intact mouse pancreatic islets

Affiliations

Patch-clamp characterisation of somatostatin-secreting -cells in intact mouse pancreatic islets

S O Göpel et al. J Physiol. .

Abstract

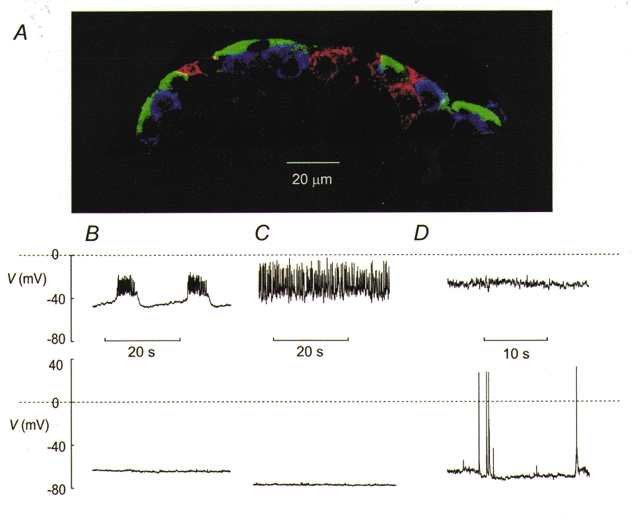
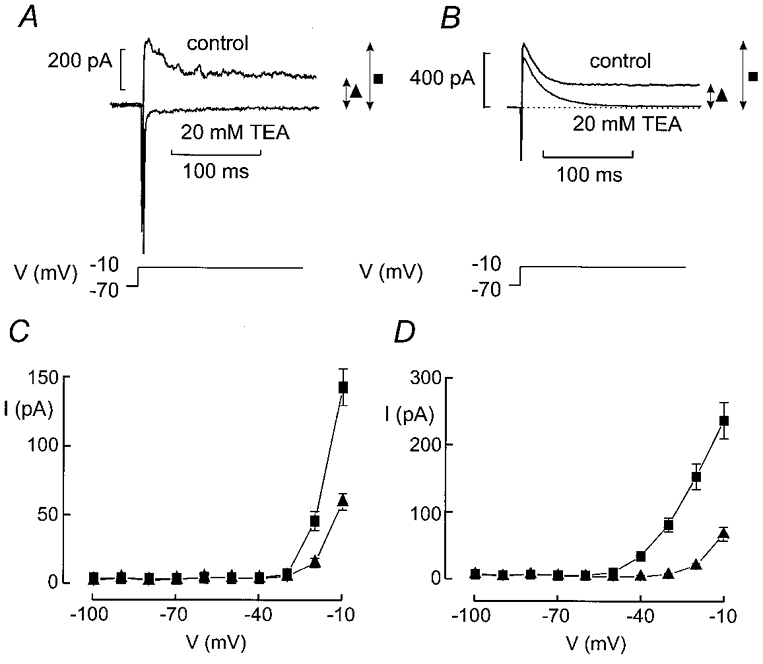
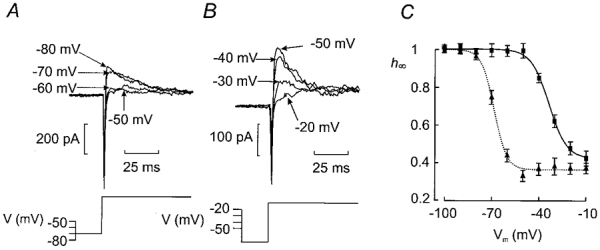
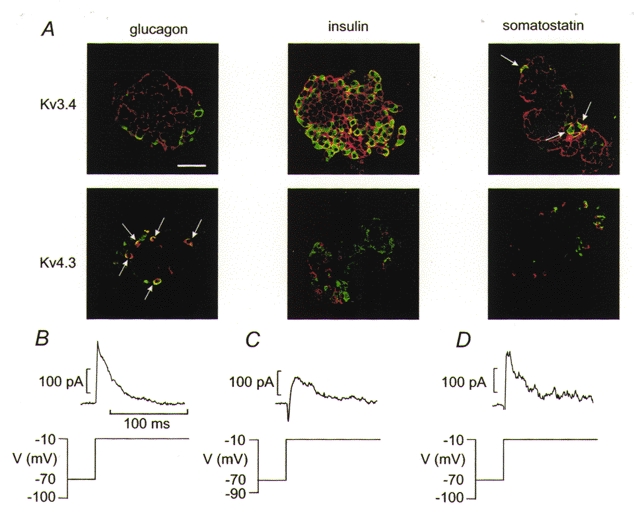
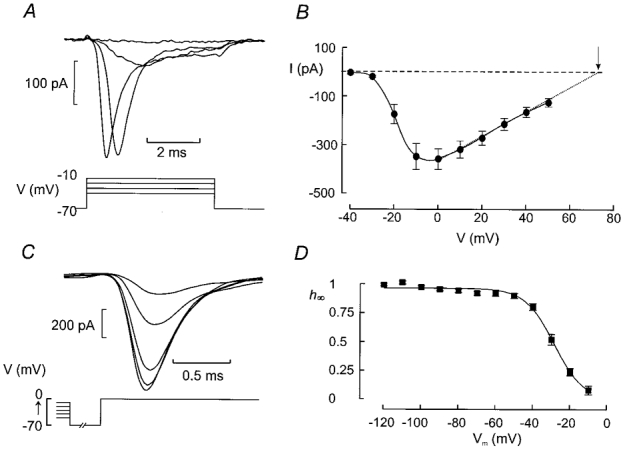
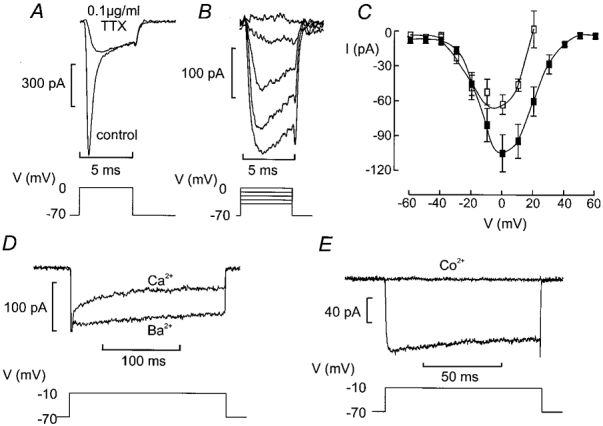
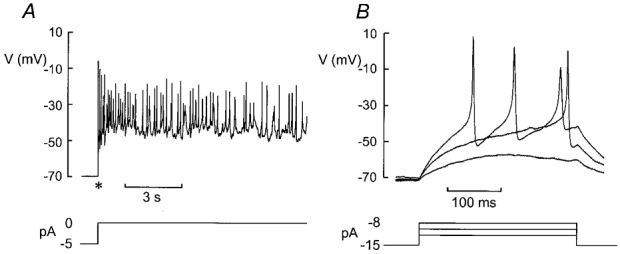
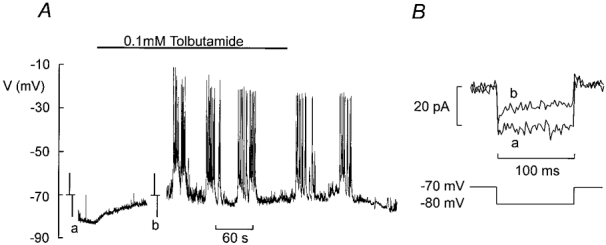
The perforated patch whole-cell configuration of the patch-clamp technique was applied to superficial cells in intact mouse pancreatic islets. Three types of electrical activity were observed corresponding to alpha-, beta- and delta-cells. The delta-cells were electrically active in the presence of glucose but lacked the oscillatory pattern seen in the beta-cells. By contrast, the alpha-cells were electrically silent at high glucose concentrations but action potentials could be elicited by removal of the sugar. Both alpha- and beta-cells contained transient voltage-activated K+ currents. In the delta-cells, the K+ currents activated above -20 mV and were completely blocked by TEA (20 mM). The alpha-cells differed from the delta-cells in possessing a TEA-resistant K+ current activating already at -40 mV. Immunocytochemistry revealed the presence of Kv3.4 channels in delta-cells and TEA-resistant Kv4.3 channels in alpha-cells. Thus the presence of a transient TEA-resistant current can be used to functionally separate the delta- and alpha-cells. A TTX-sensitive Na+ current developed in delta-cells during depolarisations beyond -30 mV and reached a peak amplitude of 350 pA. Steady-state inactivation of this current was half-maximal at -28 mV. The delta-cells were also equipped with a sustained Ca2+ current that activated above -30 mV and reached a peak of 60 pA when measured at 2.6 mM extracellular Ca2+. A tolbutamide-sensitive KATP channel conductance was observed in delta-cells exposed to glucose-free medium. Addition of tolbutamide (0.1 mM) depolarised the delta-cell and evoked electrical activity. We propose that the KATP channels in delta-cells serve the same function as in the beta-cell and couple an elevation of the blood glucose concentration to stimulation of hormone release.


Figures

Figure 1
Figure 1. Three types of electrical activity recorded from superficial islet cells
A, immunocytochemistry of mouse pancreatic islet and three types of islet electrical activity. The islet cells were labelled with antibodies against insulin (red), somatostatin (green) and glucagon (blue). B, electrical activity recorded from a β-cell in the presence (top) and absence (bottom) of 10 mm glucose. The β-cell was identified by the characteristic oscillatory electrical activity when exposed to 10 mm glucose (see Göpel et al. 1999a). C, electrical activity from a δ-cell recorded at 10 mm (top) and 1 mm (bottom) glucose. D, depolarised membrane potential in an α-cell exposed to 10 mm glucose (top) and from a different α-cell generating action potentials in the absence of glucose (bottom). The α- and δ-cells were distinguished from the β-cells by the presence of a large Na+ current and were separated by the absence (δ-cells) or presence (α-cells) of a transient A-current during voltage-clamp experiments (see Figs 2–4).
Figure 2
Figure 2. Voltage-gated currents in pancreatic α- and δ-cells
A and B, inward and outward currents elicited by voltage-clamp depolarisations from −70 mV to −10 mV in the absence and presence of 20 mm TEA. Note that whereas the outward currents are abolished in A (revealing the inward currents), a transient TEA-resistant current persists in B. The peak (▪) and sustained K+ currents (▴) were measured as indicated by the arrows. C and D, I-V relationship of the peak (▪) and sustained (▴) K+ current in cells lacking (C) or containing (D) the TEA-resistant outward current. Data are mean values ±s.e.m. of 20 and 15 experiments in C and D, respectively.
Figure 3
Figure 3. Two types of steady-state inactivation behaviour of transient K+ current in non-β-cells
A and B (bottom), prior to a test pulse to −10 mV, the cells were subjected to a 200 ms conditioning pulse to voltages between −100 and −10 mV. The test pulse was preceded by an interval of 20 ms during which the cell was held at −70 mV as indicated schematically by the voltage protocol. Each sequence was repeated at a frequency of 0·4 Hz. A and B (top), the current responses following various conditioning pulses. For clarity, only the current responses following conditioning pulses to membrane potentials between −80 and −50 mV are shown in A and between −50 and −20 mV in B. Note that inactivation occurs at more depolarised voltages in B. C, relationship between conditioning voltage (Vm) and relative current amplitude (h = I/Imax). Two subsets of cells were identified: one with inactivation occurring at negative membrane potentials (▴n = 14) and one with inactivation at more positive voltages (▪; n = 20). The current responses elicited by the depolarisation to −10 mV following a conditioning pulse to −100 mV were taken as Imax. Data are mean values ±s.e.m. The curves were obtained by fitting the Boltzmann equation (eqn (1)) to the data points.
Figure 4
Figure 4. Differential expression of Kv channels in pancreatic islet cells
A, imunocytochemical detection of Kv3.4 and Kv4.3 in pancreatic islet cells. In each panel, the presence of hormone (glucagon, insulin or somatostatin as indicated above the images) appears in the green channel and the ion channel proteins (Kv3.4 and Kv4.3 as indicated to the left of the images) are seen in the red channel. Co-localisation of hormone and ion channel is shown in yellow. Note that glucagon-secreting α-cells contain Kv4.3, whereas Kv3.4 is present in the β- and δ-cells. The scale bar is 50 μm and applies to all panels. A few glucagon-containing α-cells positive for Kv4.3 are indicated by arrows. B, inactivating K+ current component in an α-cell. The membrane currents were recorded during depolarisations to −10 mV following 200 ms conditioning pulses to either −100 or −10 mV as indicated (bottom). The resulting difference current is shown (top). C, as in B but a β-cell was used and conditioning pulses were to −90 and −10 mV. D, as in B but a δ-cell was used.
Figure 5
Figure 5. Characterisation of voltage-gated Na+ currents in pancreatic δ-cells
A, Na+ currents observed when the voltage was stepped from −70 mV to potentials between −40 and +50 mV in 10 mV increments (only first 4 pulses shown). The depolarisations were 5 ms long and applied at a frequency of ≈1 Hz. B, I-V relationship of the Na+ current in δ-cells as identified by the absence of an A-current. The dotted line and dashed horizontal line indicate the extrapolated I-V relationship and the zero current level, respectively. The arrow indicates the reversal potential. Data are mean values ±s.e.m. of 12 experiments. C, steady-state inactivation of the Na+ current in pancreatic δ-cells. The cells were subjected to a conditioning pulse (100 ms) to voltages between −120 and −10 mV prior to the 5 ms test pulse which was −10 mV. The cell was held at −70 mV for 1 ms between the conditioning pulse and the test pulse. Current responses shown are those obtained (from bottom to top) following a conditioning pulse to −50, −40, −30, −20 and −10 mV. D, relationship between conditioning voltage (Vm) and relative current amplitude (h=I/Imax). The current response elicited by a depolarisation to −10 mV following a conditioning pulse to −120 mV was taken as Imax. Mean values ±s.e.m. of 7 experiments. The curve was obtained by fitting the Boltzmann equation (eqn (1)) to the data points.
Figure 6
Figure 6. Ca2+ currents in somatostatin-secreting δ-cells
A, current responses elicited by 5 ms depolarisations from −70 mV to 0 mV under control conditions and after addition of 0·1 μg ml−1 of the Na+ channel blocker TTX. B, inward currents elicited by voltage-clamped depolarisation between −40 and 0 mV in the presence of TTX. Pulses were 5 ms long and applied at a frequency of ≈1 Hz. C, I-V relationship of the TTX-resistant current recorded with Ca2+ (□) and Ba2+ (▪) as the charge carrier. In both cases, the concentration of the divalent cation was 2·6 mm. Data are mean values ±s.e.m. of 5 experiments. D, inward currents recorded in the absence of TTX during a 200 ms depolarisation to −10 mV when Ca2+ or Ba2+ was used as the charge carrier (as indicated). The initial truncated transient corresponds to the rapidly inactivating Na+ currents. E, inhibition of Ca2+ currents by Co2+ (5 mm) using Ba2+ as charge carrier recorded in the presence of TTX. All experiments recorded in the presence of 20 mm TEA to block outward K+ currents.
Figure 7
Figure 7. Regenerative electrical activity in δ-cells
A, electrical activity recorded from a mouse δ-cell (identified by the presence of Na+ current and lack of A-current) in the presence of 10 mm glucose following the release of the voltage clamp (marked by *). B, electrical activity evoked following injection of −15 pA current to repolarise the cell to ≈-70 mV and application of 3, 5 and 7 pA current pulses to evoke action potentials.
Figure 8
Figure 8. Presence of KATP channels in δ-cells
A, electrical activity recorded from a δ-cell (identified by the presence of Na+ current and absence of an A-current) in the absence of glucose before and after addition of 0·1 mm tolbutamide (indicated by horizontal line). At the time points indicated by a and b, the recording was interrupted, the amplifier switched into voltage-clamp mode and ±10 mV pulses were applied from −70 mV to monitor membrane conductance. B, membrane currents evoked by 10 mV hyperpolarising pulses in the absence (a) and presence (b) of 0·1 mm tolbutamide. The current amplitude was measured after the capacitive transients had decayed.

Comment in

  • The Yin and Yang of the K(ATP) channel.
    Ashcroft FM. Ashcroft FM. J Physiol. 2000 Nov 1;528(Pt 3):405. doi: 10.1111/j.1469-7793.2000.t01-1-00405.x. J Physiol. 2000. PMID: 11060118 Free PMC article. No abstract available.

References

    1. Ashcroft FM, Rorsman P. Electrophysiology of pancreatic islet cells. In: Hescheler J, Scherübl H, editors. The Electrophysiology of Neuroendocrine Cells. Boca Raton, FL, USA: CRC Press; 1995. pp. 207–243.
    1. Berts A, Ball A, Dryselius S, Gylfe E, Hellman B. Glucose stimulation of somatostatin-secreting islet cells involves oscillatory Ca2+-signalling. Endocrinology. 1996;137:693–697. - PubMed
    1. Bishop AE, Polak JM. The anatomy, organisation and ultrastructure of the islets of Langerhans. In: Pickup J, Williams G, editors. Textbook of Diabetes. Vol. 1. Oxford, UK: Blackwell Science; 1997. pp. 6.1–6.16.
    1. Conley EC. VLG K A-T. In: Conley EC, Brammar WJ, editors. The Ion Channel Facts Book: Voltage-Gated Channels. Vol. 4. San Diego: Academic Press; 1999a. pp. 196–225.
    1. Conley EC. VLG K Kv3-Shaw. In: Conley EC, Brammar WJ, editors. The Ion Channel Facts Book: Voltage-Gated Channels. Vol. 4. San Diego: Academic Press; 1999b. pp. 559–616.

Publication types

MeSH terms

LinkOut - more resources