. 2000 Nov 1;528(Pt 3):521-37.
doi: 10.1111/j.1469-7793.2000.00521.x.

Membrane currents in cultured human intestinal smooth muscle cells

Affiliations

Membrane currents in cultured human intestinal smooth muscle cells

A V Zholos et al. J Physiol. .

Abstract

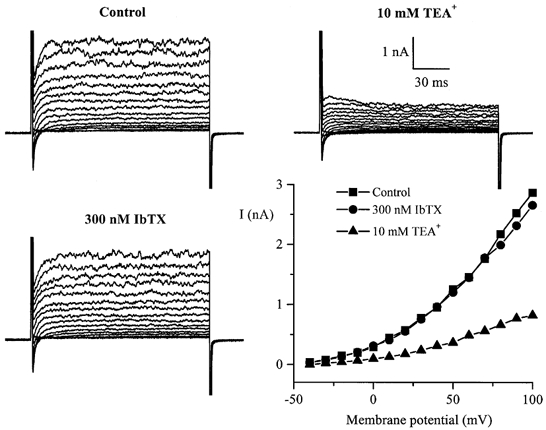
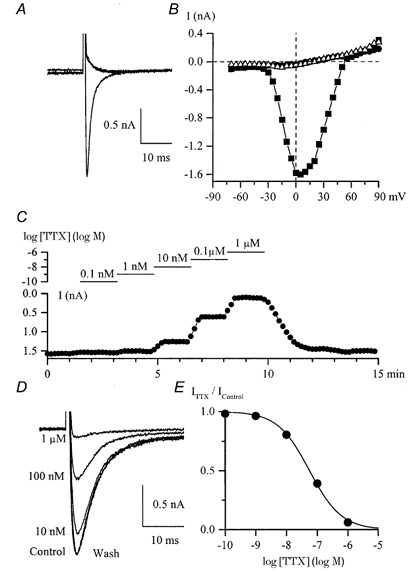
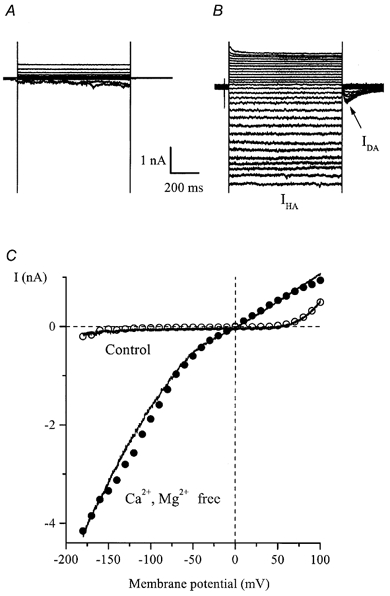
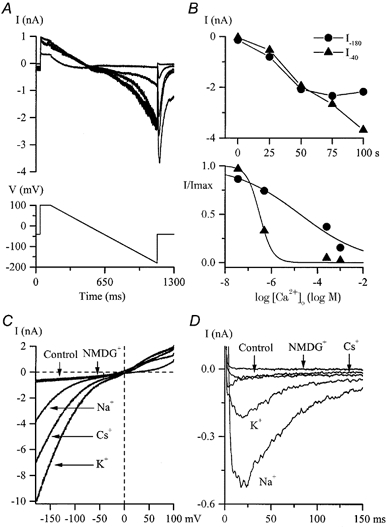
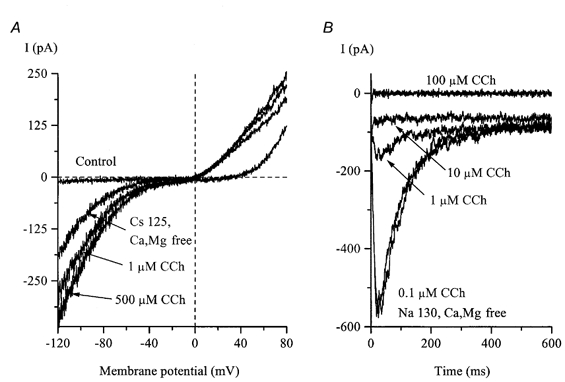
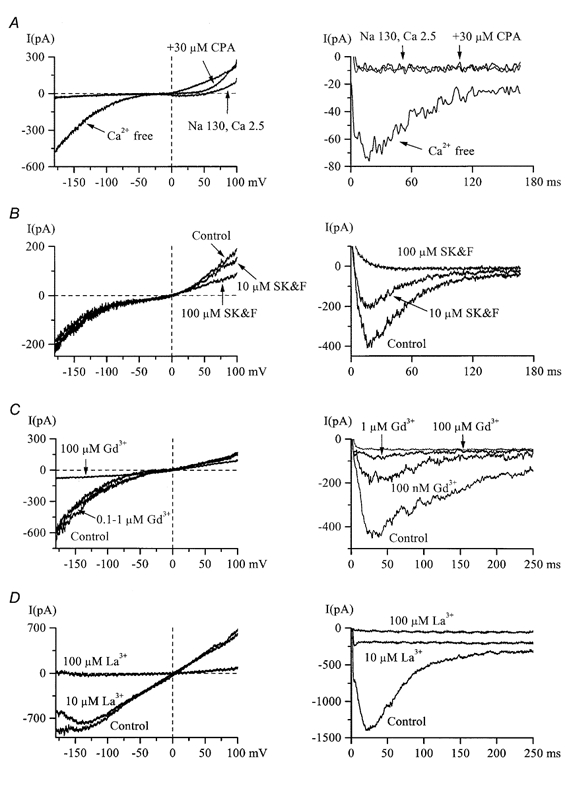
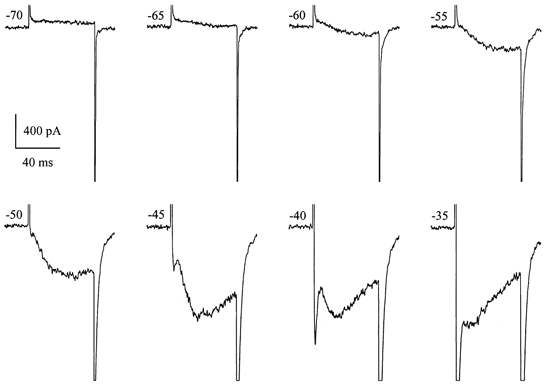
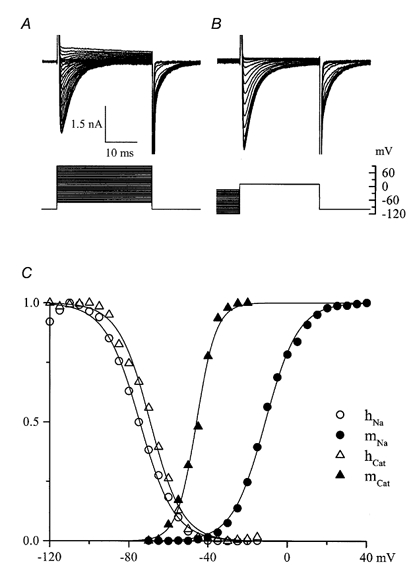
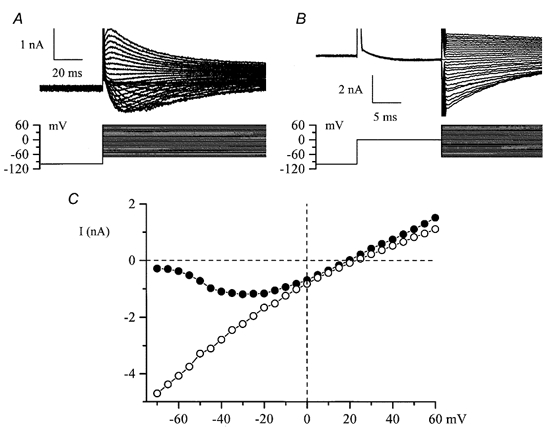
Using whole-cell patch-clamp recording techniques, we have examined voltage-gated ion currents in a cultured human intestinal smooth muscle cell line (HISM). Experiments were performed at room temperature on cells after passages 16 and 17. Two major components of the whole-cell current were a tetraethylammonium-sensitive (IC50 = 9 mM), iberiotoxin-resistant, delayed rectifier K+ current and a Na+ current inhibited by tetrodotoxin (IC50 A 100 nM). No measurable inward current via voltage-gated Ca2+ channels could be detected in these cells even with 10 mM Ca2+ or Ba2+ in the external solution. No current attributable to calcium-activated K+ channels was found and no cationic current in response to muscarinic receptor activation was present. In divalent cation-free external solution two additional currents were activated: an inwardly rectifying hyperpolarization-activated current, I(HA), and a depolarization-activated current, I(DA) x I(HA) and I(DA) could be carried by several monovalent cations; the sizes of currents in descending order were: K+ > Cs+ > Na+ for I(HA) and Na+ > K+ >> Cs+ for I(DA). I(HA) was activated and deactivated instantaneously and showed no inactivation whereas I(DA) was activated, inactivated and deactivated within tens of milliseconds. These currents were inhibited by external calcium with an IC50 of 0.3 microM for I(DA) and an IC50 of 20 microM for I(HA). Cyclopiazonic acid (CPA) induced an outward, but not an inward current. SK&F 96365, a blocker of store-operated Ca2+ channels, suppressed I(DA) with a half-maximal inhibitory concentration of 9 microM but was ineffective in inhibiting I(HA) at concentrations up to 100 microM. Gd3+ and La3+ strongly suppressed I(DA) at 1 and 10 microM, respectively and were less effective in blocking I(HA) (complete inhibition required a concentration of 100 microM for both). Carbachol at 10-100 microM evoked about a 3-fold increase in I(HA) amplitude and completely abolished I(DA). We conclude that I(HA) and I(DA) are Ca2+-blockable cationic currents with different ion selectivity profiles that are carried by different channels. I(DA) shows novel voltage-dependent properties for a cationic current.


Figures

Figure 1
Figure 1. Whole-cell membrane currents in HISM cells under quasiphysiological conditions
Families of superimposed whole-cell currents in a single cultured HISM cell evoked by 150 ms voltage pulses applied at 10 s intervals from a holding potential of −100 mV to test potentials between −40 and +100 mV with a 10 mV increment in control and in the presence of 10 mm TEA+ or 300 nm IbTX. I-V relationships were constructed by measuring the peak amplitude of the outward current at each test potential. High-K+ pipette solution and normal PSS in the bath were used.
Figure 2
Figure 2. Inward currents in a single cultured HISM cell
A, superimposed current traces elicited by depolarizing pulses to 0 mV from −100 mV in control (135 mm Na+, 2.5 mm Ca2+) and after replacement of Na+ by Cs+ (125 mm) with 10 mm CaCl2 or BaCl2 added to the external solution. B, I-V relationships for the peak inward current in control (bull) and high-Cs+ external solution with 10 mm Ca2+ (•) or 10 mm Ba2+ (▵) in the same cell. C, peak inward Na+ current was measured at +10 mV by applying voltage steps from −100 mV every 10 s upon cumulative application of ascending concentrations of TTX as shown by the horizontal lines on the logarithmic concentration scale. External solutions contained Na+ and Ca2+ but not Mg2+. D, examples of INa from the same experiment. The concentrations of TTX applied are indicated. E, concentration-effect curve for the experiment illustrated in C and D. Data points represent relative current (ITTX/IControl) fitted by the logistic function with an IC50 value of 56 nm. ITTX is the current in TTX.
Figure 3
Figure 3. Voltage-dependent properties of TTX-sensitive inward Na+ current in external solution with Ca2+ but no Mg2+
A, superimposed current traces obtained by paired subtraction of currents after 1 μm TTX application from those in control. The holding potential was −100 mV; 30 ms voltage steps were applied to test potentials ranging from −70 to +5 mV (left) and from +10 to +90 mV (right) in 5 mV increments. B, I-V relationship for the peak INa shown in A. C, activation curve obtained by dividing the peak current amplitude by the driving force at each test potential (EENa, where ENa = +65 mV) and fitted by a Boltzmann function with the following best fit parameters: maximal conductance, Gmax = 34 nS; potential of half-maximal activation, V1/2 = 0 mV; slope factor, k = −7.3 mV. D, superimposed current traces elicited by 25 ms voltage steps to +10 mV applied from various holding potentials (−120 to −15 mV in 5 mV increments). E, steady-state inactivation of INa for the experiment illustrated in D. Data points were fitted by a Boltzmann function with a potential of half-maximal inactivation of −57.4 mV and a slope factor of 9.8 mV.
Figure 4
Figure 4. Recovery of INa from inactivation
A, INa elicited by a 70 ms prepulse and a 10 ms test pulse to +10 mV applied from −100 mV with a variable interpulse interval, t (as shown below). Capacitance transients have been removed for clarity. Peak INa during the recovery process could be well fitted by a single exponential function with a time constant of 12.3 ms as shown by the dashed line. B, relative INa plotted against interpulse interval on a semilogarithmic scale at different membrane potentials (from left to right, −120 to −60 mV in 10 mV increments) and fitted by single exponential functions as shown by the continuous lines. C, voltage dependence of the time constant characterizing INa recovery from inactivation in a single experiment, fitted by a single exponential function with an e-fold increase in τ per 15.7 mV.
Figure 5
Figure 5. Inward currents in cultured HISM cells developing in divalent cation-free external solution
A and B, superimposed current traces elicited by 800 ms duration voltage steps from −40 mV to test potentials between +100 and −180 mV in 10 mV increments in control (130 mm Na+, 2.5 mm Ca2+, 1.2 mm Mg2+; A) and after external Ca2+ and Mg2+ removal (B, denoted as IHA). Note the instantaneous activation and deactivation of IHA as well as the noisy appearance of the current at negative potentials. The current seen upon repolarization to −40 mV is denoted as IDA. C, I-V relationships for currents measured at the end of the pulse (○ and •) and, in the same cell, by applying 1 s duration voltage ramps from +100 to −180 mV (continuous lines). The ramp protocol is illustrated in Fig. 6A.
Figure 6
Figure 6. Kinetics, [Ca2+]o dependence and ion permeation properties of IHA and IDA
A, typical currents during a slow voltage ramp from +100 to −180 mV and a voltage step to −40 mV slowly developing after Ca2+ and Mg2+ removal from the external solution. Superimposed current traces were recorded at 25 s intervals. B, top, maximal amplitudes of inward currents at −180 mV (•, IHA) and at −40 mV after the ramp (8, IDA) plotted against time where time zero represents the moment of Ca2+ and Mg2+ removal from the external solution. Bottom, dependence of IHA (•) and IDA (8) in the same cell on the external free Ca2+ concentration. Relative currents were fitted by logistic functions with IC50 values of 20 μm for IHA and 311 nm for IDA. C and D, external cation substitution experiments were performed on two different cells after IHA(C) and IDA(D) had been stabilized in a divalent cation-free external solution. The control I-V relationship for IHA (voltage protocol as in A) and control current response for IDA (voltage step from −100 to −40 mV) were obtained in high-Na+, 2.5 mm CaCl2-containing external solution. Traces labelled ‘Na+’ were obtained after Ca2+ removal whereas all other traces were obtained in solutions with Na+ replacement as described in the Methods. High-Cs+ pipette solution was used.
Figure 7
Figure 7. Effects of carbachol on IHA and IDA
A, the control I-V relationship was measured as described for Fig. 6C. After IHA had developed in divalent cation-free, high-Cs+ external solution, it was rapidly potentiated by carbachol (CCh) application. IDA was abolished in Cs+-containing external solution and was inactivated at −40 mV. B, in a different cell, IDA measured at −40 mV in divalent cation-free, high-Na+ external solution was strongly inhibited by carbachol.
Figure 8
Figure 8. Pharmacological properties of IHA and IDA
A, 5 min treatment with 30 μm CPA failed to induce an inward IHA (left) or IDA (right) in 2.5 mm Ca2+, high-Na+ external solution (n = 5), but both currents were readily activated following Ca2+ removal. Note that at positive potentials current could be activated by CPA. B, SK&F 96365 at concentrations of up to 100 μm did not inhibit inward IHA (left), but completely abolished IDA (right) in the same cell (n = 7). Current at positive potentials at which it could be activated by CPA (left panel in A) was also inhibited by SK&F 96365. C and D, IDA (right) was more sensitive to the inhibitory action of Gd3+ or La3+ compared to IHA (left) but both currents were abolished by 100 μm of either blocker. In all panels IHA and IDA were measured in the same cells.
Figure 9
Figure 9. Amplitude and kinetic relationships between INa and IDA
Current traces were recorded in a high-Na+, divalent cation-free solution upon voltage steps from −100 mV to various test potentials indicated beside each trace. IHA was 160, 122 and 81 pA at −100, −70 and −35 mV, respectively.
Figure 10
Figure 10. Comparison of the voltage dependence of activation and inactivation of INa and IDA
A and B, families of superimposed current traces and voltage protocols used to study the voltage dependence of activation (A) and inactivation (B). Measurements were made of INa at its peak and activation of IDA 30 ms after stepping to various potentials from a holding potential of −100 mV; at 30 ms INa is largely inactivated (cf. Fig. 3) but IDA is close to its peak value. In B the test potential was +10 mV, close to the reversal potential (Vrev) for IDA, thus minimizing its contribution during measurements of INa inactivation. Again, a 30 ms pulse allows INa to inactivate leaving IDA close to its peak value. C, open and filled circles show, respectively, normalized INa amplitude from B (hNa) and relative Na+ conductance calculated from INa amplitudes in A (mNa) as described for Fig. 3C, respectively. Filled and open triangles show relative tail current amplitudes from A (mCat) and B (hCat), respectively, measured by fitting single exponential functions and extrapolating to time zero at the end of each test pulse. Data points were fitted by Boltzmann functions with the following best fit parameters: INa activation: V1/2 = −11.1 mV; k = −8.3 mV; INa inactivation: V1/2 = −74.5 mV, k = 8.8 mV; IDA activation: V1/2 = −45.8 mV, k = −5.0 mV; IDA inactivation: V1/2 = −69.2 mV, k = 8.1 mV. This cell was in 130 mm Na+, divalent cation-free solution; IHA was small (-145 and +155 pA at −100 and +90 mV, respectively).
Figure 11
Figure 11. I-V relationships for IDA
A and B, voltage protocols and superimposed current traces recorded in the same cultured HISM cell using high-Cs+ pipette and high-K+, divalent cation-free external solution in which INa is abolished and IDA can be measured. IHA was relatively small in this cell: measured by applying voltage ramps from −40 mV to inactivate IDA, IHA amplitude was −427 pA at −70 mV and 315 pA at +60 mV. In B steps were in the range −70 to +60mV. Tail current was flat at +20 mV. C, I-V relationships for the peak IDA in A (•) and instantaneous tail current amplitude in B (○), measured as described for Fig. 10B. Tail current reversed at +23 mV which was 3 mV more positive than the peak IDA reversal potential. This discrepancy could arise as a result of some contamination of the peak IDA by IHA, as explained above, for which Vrev 0 mV.

Similar articles

Cited by

References

    1. Almers W, Mc Cleskey EW, Palade PT. A non-selective cation conductance in frog muscle membrane blocked by micromolar external calcium ions. Journal of Physiology. 1984;353:565–583. - PMC - PubMed
    1. Armstrong CM. Distinguishing surface effects of calcium ion from pore-occupancy effects in Na+ channels. Proceedings of the National Academy of Sciences of the USA. 1999;96:4158–4163. - PMC - PubMed
    1. Armstrong CM, Cota G. Calcium block of Na+ channels and its effect on closing rate. Proceedings of the National Academy of Sciences of the USA. 1999;96:4154–4157. - PMC - PubMed
    1. Benham CD, Bolton TB, Lang RJ. Acetylcholine activates an inward current in single mammalian smooth muscle cells. Nature. 1985;316:345–347. - PubMed
    1. Bielefeldt K, Waite L, Abboud FM, Conklin JL. Nongenomic effects of progesterone on human intestinal smooth muscle cells. American Journal of Physiology. 1996;271:G370–376. - PubMed

Publication types

LinkOut - more resources