. 2000 Nov 1;528(Pt 3):633-45.
doi: 10.1111/j.1469-7793.2000.00633.x.

Time-varying changes in corticospinal excitability accompanying the triphasic EMG pattern in humans

Affiliations

Time-varying changes in corticospinal excitability accompanying the triphasic EMG pattern in humans

C D MacKinnon et al. J Physiol. .

Abstract

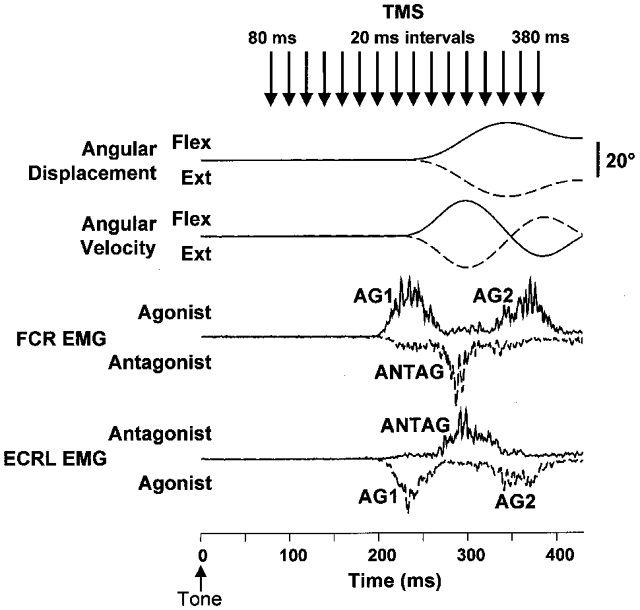
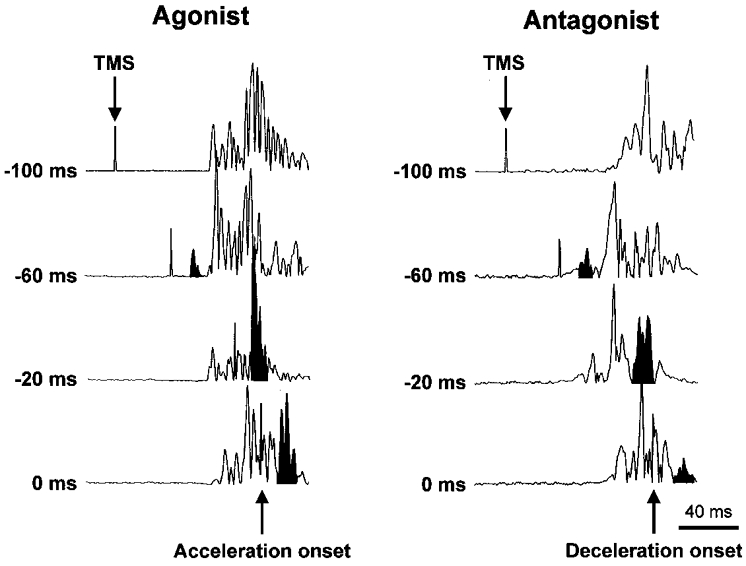
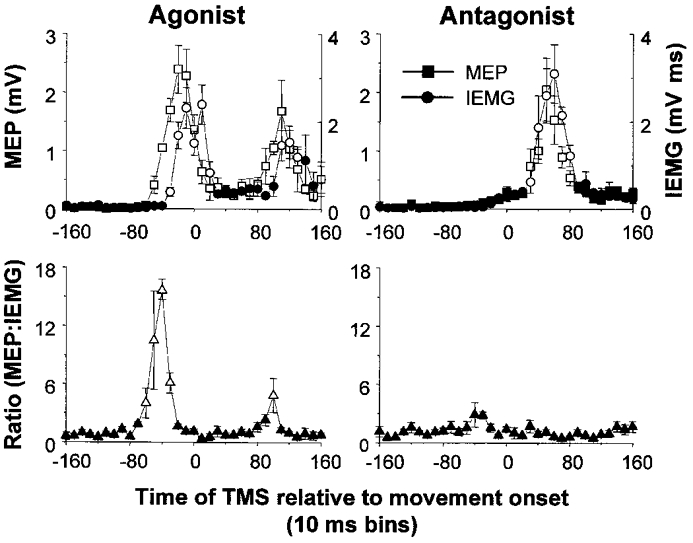
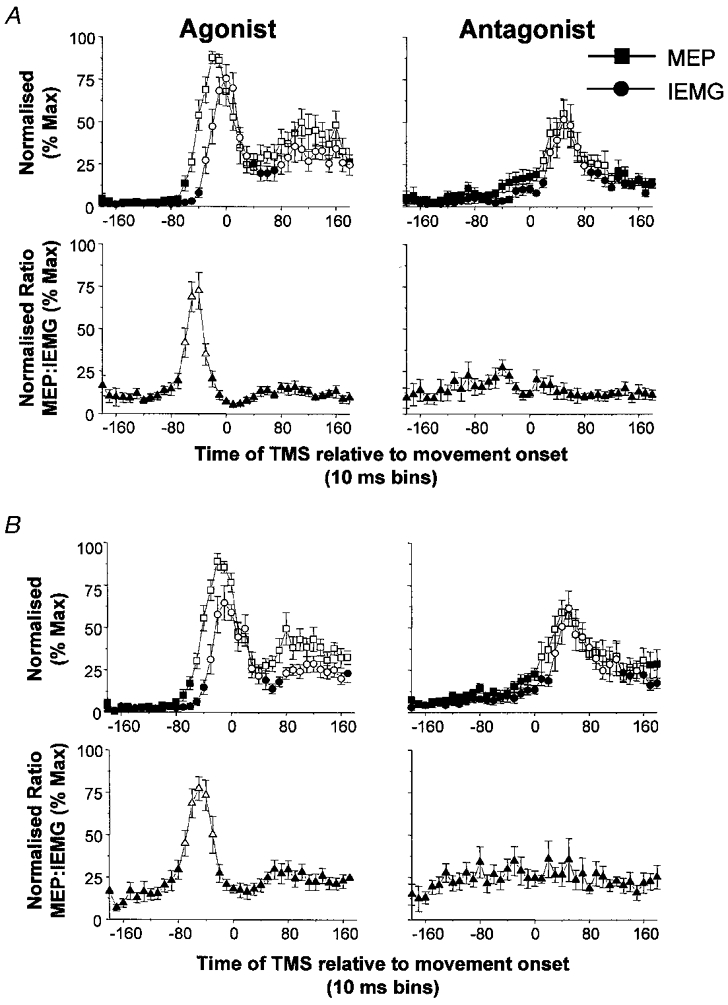
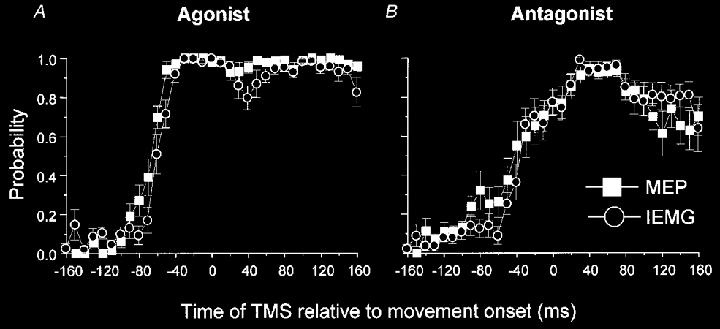
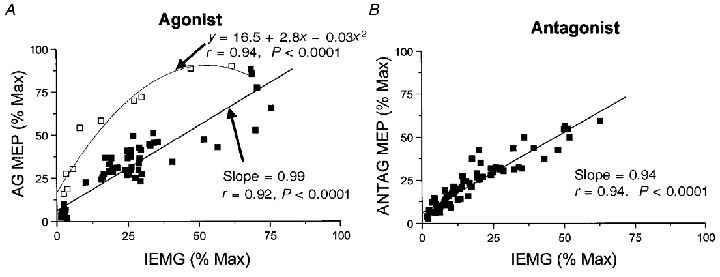
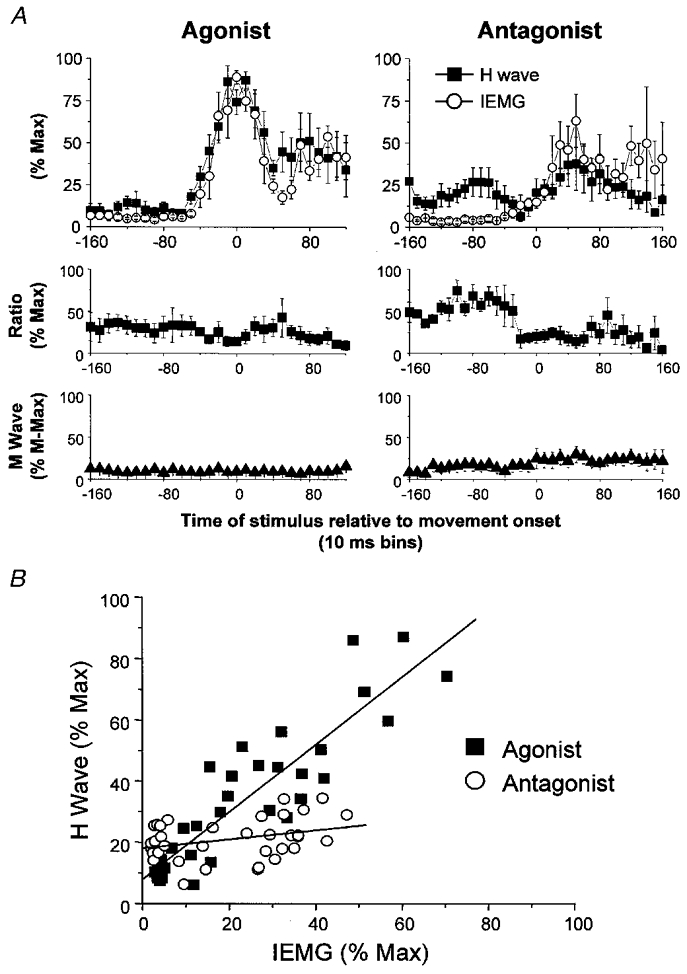
Nine healthy subjects performed single rapid wrist movements from neutral to targets at 20 deg of flexion or extension in response to an auditory cue. Surface EMG was recorded from the wrist flexors and extensors together with wrist position. Movements in both directions were characterised by the usual triphasic pattern of EMG activity in agonist (AG1), antagonist (ANTAG) and again in agonist (AG2) muscles. Single pulses of transcranial magnetic stimulation (TMS) were applied over the motor cortex at an intensity of 80 % of resting threshold at random times between 80 and 380 ms after the cue. We measured the peak-to-peak amplitude of the evoked motor potential (MEP) and the integrated EMG (IEMG) activity that preceded the MEP. In a separate set of experiments H reflexes were elicited in the wrist flexors instead of MEPs. MEP amplitudes in the agonist muscle increased by an average of 10 +/- 8 ms (range -1 to 23 ms) prior to the onset of the AG1 burst and were associated with an increase of over sevenfold in the MEP:IEMG ratio, irrespective of movement direction. Agonist H reflex amplitudes were linearly related to, and increased at the same time as, changes in agonist IEMG. The principal ANTAG burst was not preceded by an increase in the antagonist muscle MEP:IEMG ratio. No relationship was found between the amplitude of the antagonist H reflexes and the preceding antagonist IEMG. Five subjects showed an increase in the MEP:IEMG ratio preceding and during the initial part of the AG2 burst. Our method of analysis shows that changes in motor cortical excitability mediating the initiation of movement occur much closer to the onset of EMG activity (less than 23 ms) than the 80-100 ms lead time previously reported. The lack of such changes before the onset of the ANTAG burst suggests that this may be initiated by a different, perhaps subcortical, mechanism.


Figures

Figure 1
Figure 1. Examples of the angular displacement, velocity and rectified EMG for flexor carpi radialis (FCR) and extensor carpi radialis longus (ECRL) during wrist flexion and extension movements in a single subject
Each trace is the average of 15 trials. Continuous lines are for flexion trials and dashed lines are for extension trials. Note the characteristic triphasic pattern of EMG activity (AG1, ANTAG and AG2) associated with movements in both directions. The arrows at the top of the figure show the times that TMS was applied across trials. The auditory tone was presented at 0 ms.
Figure 2
Figure 2. Examples of MEPs evoked at four time intervals when FCR functioned as the initial agonist and antagonist
The times to the left of each plot indicate the timing of TMS expressed relative to the onset of acceleration for the agonist plots and relative to the onset of deceleration for the antagonist plots. Note the marked increase in the agonist MEPs 60 ms before movement onset in the absence of background EMG. In contrast, when the same muscle functioned as the antagonist, small MEPs were evoked despite increases in background EMG.
Figure 3
Figure 3. Time-varying changes in the amplitude of the MEPs, IEMG and MEP:IEMG ratios in FCR during wrist flexion or extension movements in a single subject
Plots on the left show profiles when FCR functioned as the agonist (wrist flexion) and plots on the right show profiles when FCR functioned as the antagonist (wrist extension). Responses have been sorted into 10 ms time bins. In this subject, MEPs increased prior to the onset of the AG1 and AG2 bursts. The phase advance resulted in a marked increase in the MEP:IEMG ratio prior to both agonist bursts. In contrast, MEPs and IEMGs increased within the same time bins when the same muscle functioned as the antagonist, resulting in no significant change in the MEP:IEMG ratio from baseline levels. Open symbols denote values that were significantly different from baseline (P < 0.05). Error bars are one standard error of the mean.
Figure 4
Figure 4. Time-varying changes in the amplitude of the MEPs, IEMG and MEP:IEMG ratios in FCR and ECRL when the same muscle functioned as an agonist and antagonist averaged across nine subjects
A, data for FCR; B, data for ECRL. Squares, MEP; circles, IEMG; triangles, MEP:IEMG ratio. Open symbols denote values that were significantly different from baseline (P < 0.05). Values have been normalised to the maximum average response within subjects. Increases in agonist MEPs preceded the AG1 burst by two or three time bins (range = 10–34 ms). The early increase in the agonist MEPs resulted in marked increases in the MEP:IEMG ratio prior to, and during the rising phase of, the AG1 burst. In contrast, changes in antagonist MEPs were accompanied by proportionate changes in pre-existing IEMG, resulting in no significant changes in the ratio from baseline levels. Error bars are one standard error of the mean.
Figure 5
Figure 5. Time course of the changes in the probability of evoking an MEP or recording IEMG levels of greater than two standard deviations from baseline when the muscle functioned as an agonist (A) and antagonist (B)
Data from FCR and ECRL have been pooled and averaged across subjects. When the muscle functioned as the agonist, the probability of evoking an MEP increased prior to changes in IEMG probability, but the lead time was less than 28 ms. Similarly, when the muscle functioned as the antagonist the probability of evoking an MEP increased before the changes in IEMG probability associated with the initial antagonist burst, but not prior to the principal ANTAG burst. Error bars are one standard error of the mean.
Figure 6
Figure 6. Relationships between the amplitude of the MEPs and IEMG when muscles functioned as the agonist (A) and antagonist (B)
A, a linear regression was performed and a line of best fit drawn through agonist muscle data points from −180 to −70 ms and −10 to 180 ms (▪). Data points correspond to normalised responses averaged across subjects for both FCR and ECRL. The fit of the line to these data was highly significant (r = 0.92, P < 0.0001). Data points from −60 to −20 ms (□) were best fitted by a second-order polynomial function (r = 0.94, P < 0.0001). B, a linear regression was conducted and a line of best fit drawn through all antagonist muscle data points (-180 to 180 ms). A linear relationship (r = 0.94, P < 0.0001) between the antagonist MEPs and IEMG was maintained throughout the movement.
Figure 7
Figure 7. Relationships between the amplitude of the H wave and IEMG when FCR functioned as an agonist and antagonist
A, time-varying changes in the amplitude of the H wave, IEMG, H wave:IEMG ratio and M wave, when FCR functioned as an agonist (plots on the left) and an antagonist (plots on the right), averaged across four subjects. Increases in agonist H waves preceded the AG1 burst by no more than one time bin. The initial antagonist burst was preceded by a small facilitation of the H wave whereas the principal ANTAG burst was not preceded by an increase in the H wave. The H wave:IEMG ratio did not change when FCR functioned as an agonist, but decreased at EMG onset when FCR functioned as the antagonist. M wave amplitudes remained the same throughout the movement irrespective of whether FCR was the agonist or antagonist. Error bars are one standard error of the mean. B, a linear regression was performed between the amplitude of the H wave and IEMG when FCR functioned as the agonist (▪) and antagonist (○) and a line of best fit was drawn through all data points (-180 to 180 ms). The linear relationship was significant for the agonist data (r = 0.90, P < 0.0001), but not for the antagonist data (r = 0.33, P > 0.05).

References

    1. Baker SNB, Olivier E, Lemon RN. Recording the pyramidal volley evoked by transcranial magnetic stimulation in a conscious monkey. Experimental Brain Research. 1994;99:529–533. - PubMed
    1. Berardelli A, Hallett M, Rothwell JC, Agostino R, Manfredi M, Thompson PD, Marsden CD. Single-joint rapid arm movements in normal subjects and in patients with motor disorders. Brain. 1996;119:661–674. - PubMed
    1. Chen R, Yaseen Z, Cohen LG, Hallett M. Time course of corticospinal excitability in reaction time and self-paced movements. Annals of Neurology. 1998;44:317–325. - PubMed
    1. Cheney PD, Fetz EE. Functional classes of primate corticomotoneuronal cells and their relation to active force. Journal of Neurophysiology. 1980;44:773–791. - PubMed
    1. Cheney PD, Fetz EE, Palmer SS. Patterns of facilitation and suppression of antagonist forelimb muscles from motor cortex sites in the awake monkey. Journal of Neurophysiology. 1985;53:805–820. - PubMed

Publication types

LinkOut - more resources