. 2000 Oct;11(2):93-103.
doi: 10.1002/1097-0193(200010)11:2<93::AID-HBM30>3.0.CO;2-Y.

Quantitative maps of GAbAergic and glutamatergic neuronal systems in the human brain

Affiliations

Quantitative maps of GAbAergic and glutamatergic neuronal systems in the human brain

D Sutoo et al. Hum Brain Mapp. 2000 Oct.

Abstract

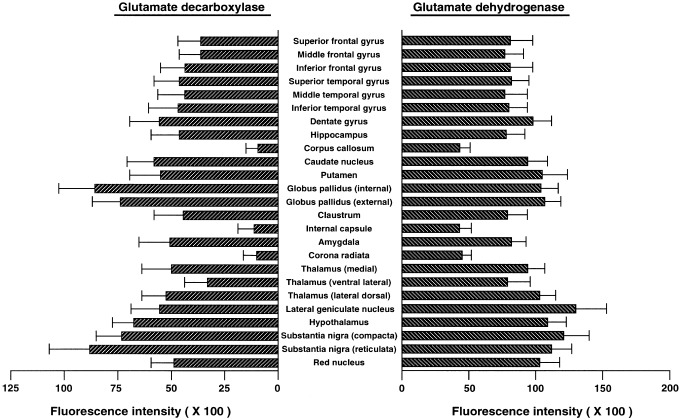
GABAergic and glutamatergic neuronal systems in adult normal human brains were shown quantitatively and in detail through the distributions of glutamate decarboxylase (GAD) and glutamate dehydrogenase (GDH), respectively. Consecutive coronal sections containing part of the striatum and the substantia nigra were obtained from the right hemisphere of three deceased persons with no history of neurological or psychiatric diseases and were stained immunohistochemically for GAD and GDH. Each stained section was divided into approximately 3 million microareas and the immunohistochemical fluorescence intensity in each area was measured by a human brain mapping analyzer, which is a microphotometry system for analysis of the distribution of neurochemicals in a large tissue slice. In the analyzed brain regions, conspicuously intense GAD-like immunoreactivity was observed in the substantia nigra, globus pallidus, and hypothalamus. GDH was widely and rather evenly distributed in the gray matter compared to GAD, although intense GDH-like immunoreactivity was observed in the lateral geniculate nucleus and substantia nigra. Within the substantia nigra, the globus pallidus, and other regions, characteristic distributions of GAD- and GDH-like immunoreactivity were found. We believe that the analysis of the human brain by this novel technique can help to understand the functional distribution of neuronal systems in the normal human brain and may be able to identify abnormal changes in the diseased human brain. It can also provide basic data to help in the interpretation of functional magnetic resonance imaging or positron emission tomography.


Figures

Figure 1
Figure 1
Examples of coronal sections of the human brain analyzed for the distribution of GAD and GDH. In the insets, the vertical dotted lines indicate the level and axis of the analyzed coronal area, and the solid line indicates the plane of this section. The data of Figures 3 and 4 were obtained from the section levels A and B, respectively. After measurement of the distribution of GAD or GDH, the slices were stained with cresyl violet, and the precise brain regions were identified using human brain atlases [Riley, 1960; Roberts and Hanaway, 1970; Binder et al., 1979; Mai et al., 1997]. Abbreviations: Am, amygdala; CC, corpus callosum; Cd, caudate nucleus; Cl, claustrum; CR, corona radiata; DG, dentate gyrus; FGi, inferior frontal gyrus; FGm, middle frontal gyrus; FGs, superior frontal gyrus; GPe, external segment of globus pallidus; GPi, internal segment of globus pallidus; Hp, hippocampus; Hy, hypothalamus; IC, internal capsule; LG, lateral geniculate nucleus; Pt, putamen; RN, red nucleus; SNc, substantia nigra pars compacta; SNr, substantia nigra pars reticulata; TGi, inferior temporal gyrus; TGm, middle temporal gyrus; TGs, superior temporal gyrus; THd, lateral dorsal nucleus of thalamus; THl, ventral lateral nucleus of thalamus; THm, medial nucleus of thalamus.
Figure 2
Figure 2
Elimination of nonspecific autofluorescence in the brain slice. The distributions of fluorescence intensity were scanned from a to b in the quite same slice before and after immunohistochemical staining. The distribution in A indicates nonspecific autofluorescence, and that in B indicates immunohistochemical fluorescence superimposed on nonspecific autofluorescence. The difference between A and B, namely, the distribution of immunohistochemical fluorescence intensity is shown in C.
Figure 3
Figure 3
A and C: Quantitative immunohistochemical distributions of GAD (A) and GDH (C) in a right hemispheric brain slice in an adult normal human (male, age 50). This area is the same as that shown in Figure 1A. Data was obtained from approximately 3 million regions in the brain at 50‐μm intervals. The immunohistochemical fluorescence intensities of GAD or GDH are shown as relative values compared with the standard intensity of uranium glass. B and D: The distributions of GAD (B) and GDH (D) in the globus pallidus, putamen and caudate nucleus areas are in the same slice as that shown in A and C, respectively. Data were obtained at 20‐μm intervals. Immunohistochemical fluorescence intensities were classified into eight ranks and are indicated by color coding as follows: In A, 0.00–0.09 (black), 0.10–0.20 (deep blue), 0.21–0.31 (light blue), 0.32–0.42 (green), 0.43–0.53 (yellow), 0.54–0.64 (red), 0.65–0.75 (pink), and 0.76 or more (white); In B, 0.21–0.92 (deep blue to pink); in C, 0.46–1.11 (deep blue to pink); and in D, 0.43–1.32 (deep blue to pink).
Figure 4
Figure 4
A and C: Quantitative immunohistochemical distributions of GAD (A) and GDH (C) in a right hemispheric brain slice in an adult normal human. This area is the same as that shown in Figure 1B. Data were obtained from approximately 3 million regions in the brain at 50‐μm intervals. The immunohistochemical fluorescence intensities of GAD or GDH are expressed relative to the standard intensity of uranium glass. B and D: The distribution of GAD (B) and GDH (D) in the substantia nigra are in the same level as that shown in A and C. Data were obtained at 20‐μm intervals. Immunohistochemical fluorescence intensities were classified into eight ranks and are indicated by color coding as described in Figure 3.
Figure 5
Figure 5
Immunohistochemical fluorescence intensities of GAD and GDH in various brain regions of the normal human brain. Each value represents the mean ± SEM of 60 data points (obtained at random from 12 slices, 4 slices in each of three brains) per 40‐μm diameter area relative to the intensity of uranium glass. The background fluorescence intensity was subtracted from the total fluorescence intensity at each measuring point and the values were averaged.

Similar articles

Cited by

References

    1. Albin RL, Young AB, Penney JB (1989): The functional anatomy of basal ganglia disorders. Trends Neurosci 12: 366–375. - PubMed
    1. Alexander GE, Crutcher M (1990): Functional architecture of basal ganglia circuits: neuronal substrates of parallel processing. Trends Neurosci 13: 266–271. - PubMed
    1. Aoki C, Milner TA, Sheu KFR, Blass JP, Pickel VM (1987): Regional distribution of astrocytes with intense immunoreactivity for glutamate dehydrogenase in rat brain: implications for neuron‐glia interactions in glutamate transmission. J Neurosci 7: 2214–2231. - PMC - PubMed
    1. Babb TL, Pretorius JK, Kupfer WR, Crandall PH (1989): Glutamate decarboxylase‐immunoreactive neurons are preserved in human epileptic hippocampus. J Neurosci 9: 2562–2574. - PMC - PubMed
    1. Binder GA, Haughton VM, Ho KC (1979): Computed tomography of the brain in axial, coronal, and sagittal planes. Boston: Little, Brown.

Publication types

LinkOut - more resources