. 2000 Nov 6;192(9):1353-64.
doi: 10.1084/jem.192.9.1353.

C-Reactive protein binds to apoptotic cells, protects the cells from assembly of the terminal complement components, and sustains an antiinflammatory innate immune response: implications for systemic autoimmunity

Affiliations

C-Reactive protein binds to apoptotic cells, protects the cells from assembly of the terminal complement components, and sustains an antiinflammatory innate immune response: implications for systemic autoimmunity

D Gershov et al. J Exp Med. .

Erratum in

  • J Exp Med 2001 Jun 18;193(12):1439

Abstract

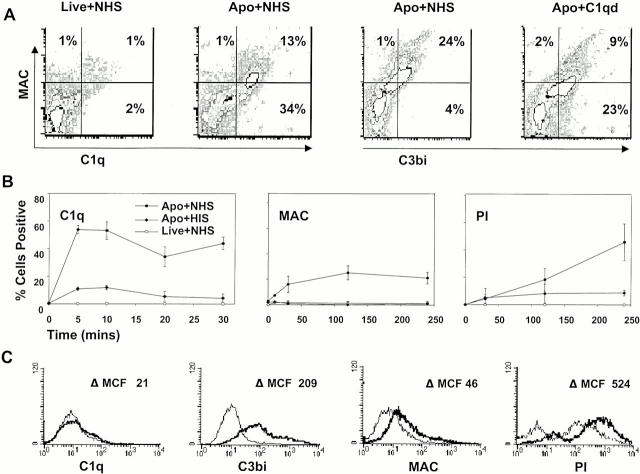
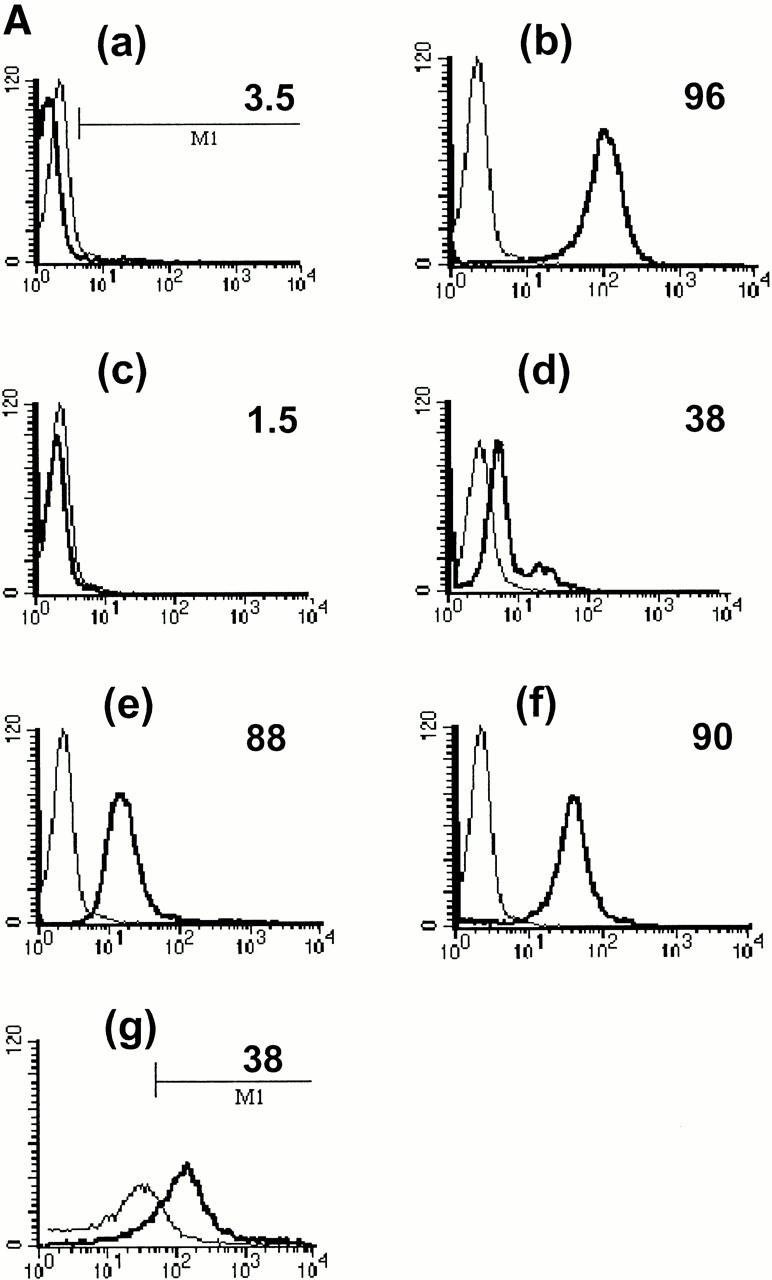
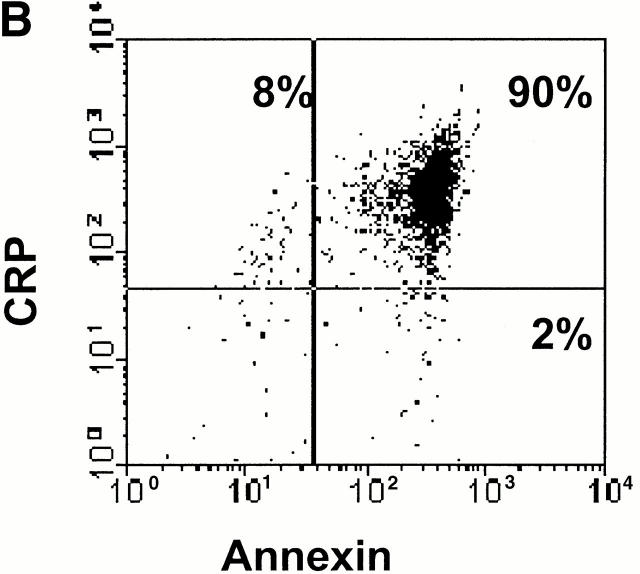
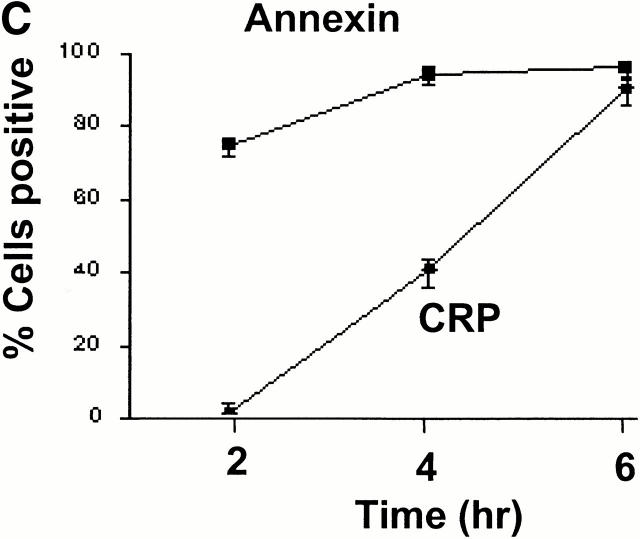
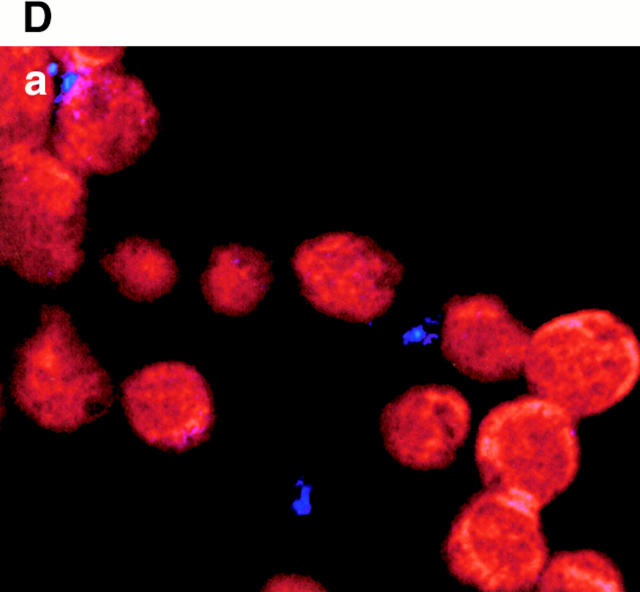
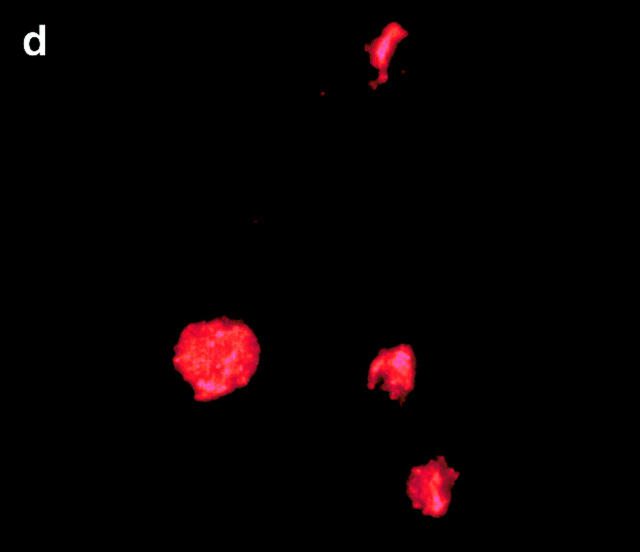
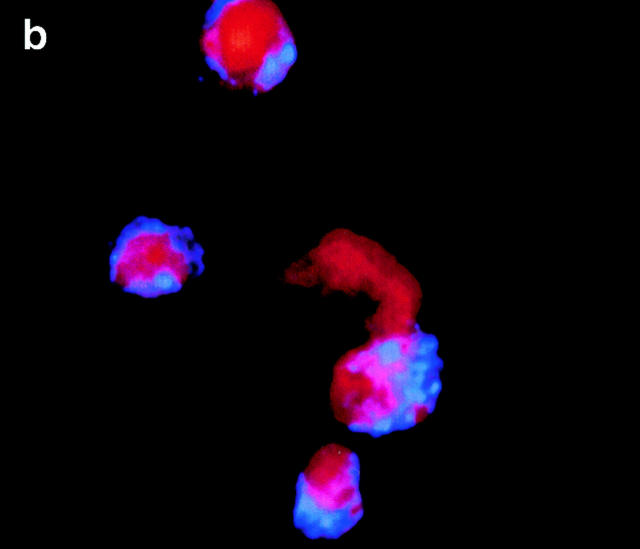
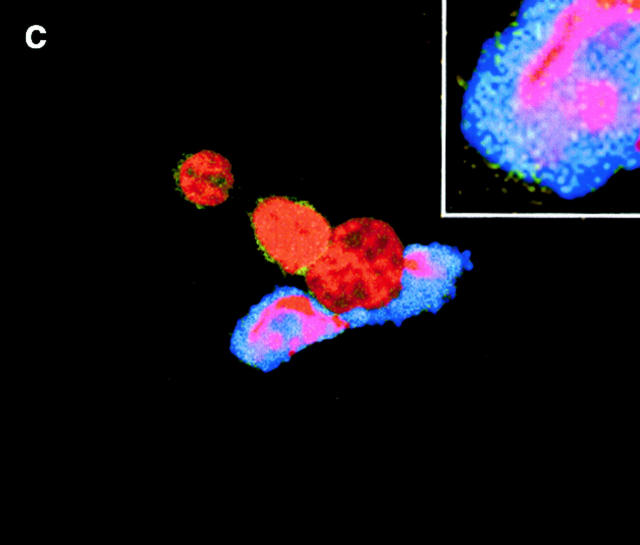
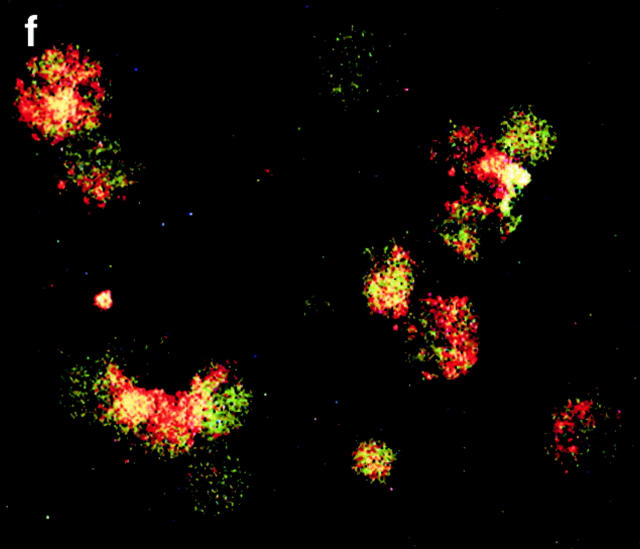
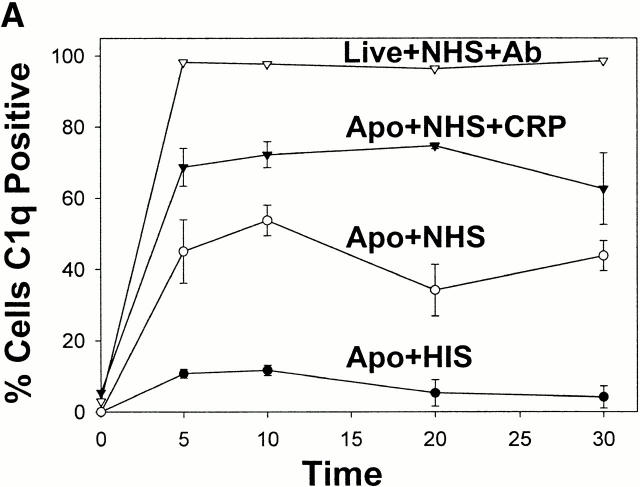
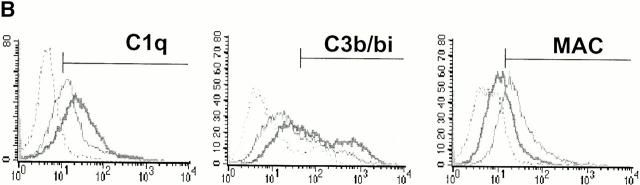
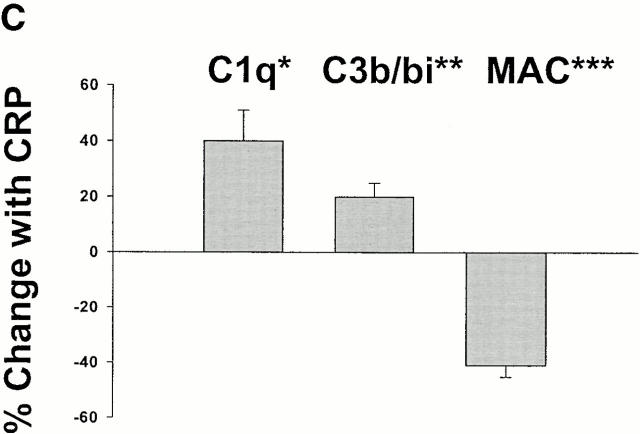
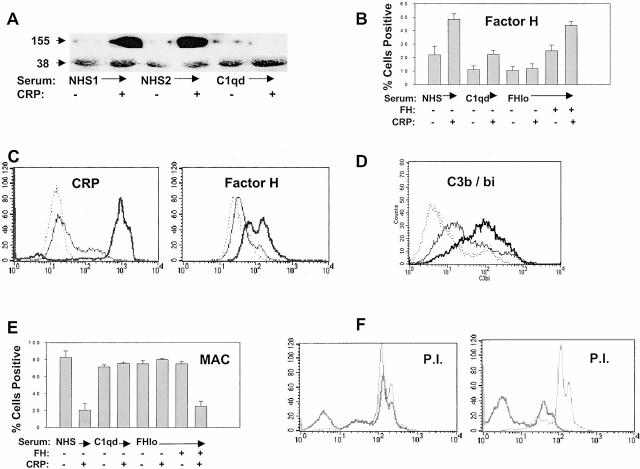
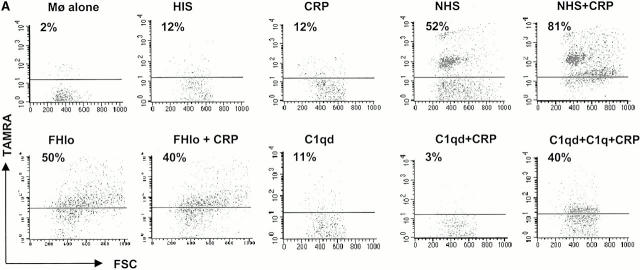
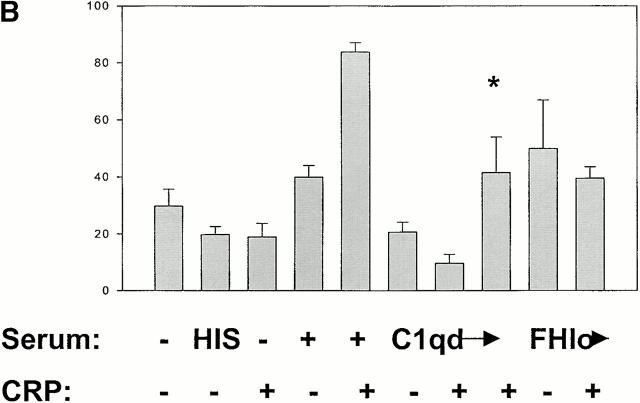
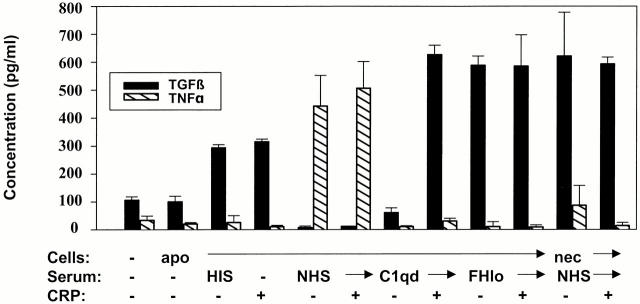
C-reactive protein (CRP) is a serum protein that is massively induced as part of the innate immune response to infection and tissue injury. As CRP has been detected in damaged tissues and is known to activate complement, we assessed whether apoptotic lymphocytes bound CRP and determined the effect of binding on innate immunity. CRP bound to apoptotic cells in a Ca(2+)-dependent manner and augmented the classical pathway of complement activation but protected the cells from assembly of the terminal complement components. Furthermore, CRP enhanced opsonization and phagocytosis of apoptotic cells by macrophages associated with the expression of the antiinflammatory cytokine transforming growth factor beta. The antiinflammatory effects of CRP required C1q and factor H and were not effective once cells had become necrotic. These observations demonstrate that CRP and the classical complement components act in concert to promote noninflammatory clearance of apoptotic cells and may help to explain how deficiencies of the classical pathway and certain pentraxins lead to impaired handling of apoptotic cells and increased necrosis with the likelihood of immune response to self.


Figures

Figure 1
Figure 1
Complement assembles on the surfaces of apoptotic cells and leads to cell lysis. Apoptosis was induced in Jurkat (A and B) and peripheral blood–derived (C) T cells with staurosporin and then analyzed by flow cytometry for binding of complement components as well as cell permeability to PI as described in Materials and Methods. In this and subsequent figures, “apoptotic cells” (Apo) include 20–30% live cells (annexin V negative). In A and B, live or apoptotic cells were incubated with 20% NHS, HIS, or C1qd serum for 30 min before analysis. Gates were set with isotype control antibodies. In A, cells were analyzed after 20 min for C1q and MAC binding and after 30 min for C3b/bi and MAC binding. In B, cells were analyzed at different time points as indicated. The mean ± SE of three experiments is shown. In C, apoptotic cells were incubated with HIS (thin line) or NHS (thick line) and then analyzed at 30 min except for PI staining, which was evaluated at 2 h. Results are expressed as the change in mean channel fluorescence (ΔMCF). The results shown in A and C are representative of three to five experiments.
Figure 2
Figure 2
CRP binds to the surfaces of apoptotic cells. (A) Live (a), necrotic (b), or apoptotic (c–g) T cells were incubated with purified CRP, 0.5 (d) or 50 μg/ml (a–c, e–g), for 20 min at room temperature. Jurkat T cells were used for all experiments except for g, where normal human T cells were used. Apoptosis was induced by staurosporin, except for in e, where anti-Fas was used. Necrosis was induced by heat (65°C for 1 h) as described in Materials and Methods. CRP binding was assessed by flow cytometry using either isotype control (thin line) or anti-CRP antibody (thick line). In c, CRP binding studies were performed in the presence of 10 mM EDTA. The results are expressed as the percentage of cells positive for binding and are representative of five individual experiments. (B) Apoptotic Jurkat cells were incubated with CRP (50 μg/ml) as in A and analyzed by two-color flow cytometry with anti-CRP and annexin V. The kinetics of binding are shown in C (mean ± SD of three experiments). In C, time 0 is taken from the exposure of cells to the apoptotic stimulus (whereas the kinetics of complement binding in Fig. 1 B and 3 A were performed with cells that were already apoptotic). (D) Live (a) or apoptotic (b–f) Jurkat cells were incubated with 50 μg/ml CRP. The cells were washed and stained with anti-CRP, followed by Cy-5–conjugated (blue, a–c) or PE-conjugated (red, d–f) secondary antibodies. In a–c, the cells were then cytocentrifuged onto glass slides, fixed, and counterstained with PI (red) and analyzed by confocal microscopy. In d–f, the cells were not counterstained and were analyzed by immunofluorescence. In c, cells were coincubated with CRP and annexin V–FITC (green) to compare the patterns of staining between CRP and annexin V. In d, apoptotic cells were permeabilized before incubation with CRP and anti-CRP so as to compare the patterns of binding to apoptotic cells that were not permeabilized (b and e) before exposure to CRP. In e and f, nonpermeabilized (e) or permeabilized (f) apoptotic cells were incubated with 50 μg/ml CRP and an anti-Sm/RNP–containing antiserum (1:200 dilution). Sm/RNP antibodies were detected using FITC-conjugated goat anti–human IgG (green). Colocalization of snRNP and CRP appears yellow. Confocal images a and c are projections of a stack of 12 slices, and b is a single optical slice at ×64 magnification. Magnification for immunofluorescence is ×60. In c, inset = ×224.
Figure 2
Figure 2
CRP binds to the surfaces of apoptotic cells. (A) Live (a), necrotic (b), or apoptotic (c–g) T cells were incubated with purified CRP, 0.5 (d) or 50 μg/ml (a–c, e–g), for 20 min at room temperature. Jurkat T cells were used for all experiments except for g, where normal human T cells were used. Apoptosis was induced by staurosporin, except for in e, where anti-Fas was used. Necrosis was induced by heat (65°C for 1 h) as described in Materials and Methods. CRP binding was assessed by flow cytometry using either isotype control (thin line) or anti-CRP antibody (thick line). In c, CRP binding studies were performed in the presence of 10 mM EDTA. The results are expressed as the percentage of cells positive for binding and are representative of five individual experiments. (B) Apoptotic Jurkat cells were incubated with CRP (50 μg/ml) as in A and analyzed by two-color flow cytometry with anti-CRP and annexin V. The kinetics of binding are shown in C (mean ± SD of three experiments). In C, time 0 is taken from the exposure of cells to the apoptotic stimulus (whereas the kinetics of complement binding in Fig. 1 B and 3 A were performed with cells that were already apoptotic). (D) Live (a) or apoptotic (b–f) Jurkat cells were incubated with 50 μg/ml CRP. The cells were washed and stained with anti-CRP, followed by Cy-5–conjugated (blue, a–c) or PE-conjugated (red, d–f) secondary antibodies. In a–c, the cells were then cytocentrifuged onto glass slides, fixed, and counterstained with PI (red) and analyzed by confocal microscopy. In d–f, the cells were not counterstained and were analyzed by immunofluorescence. In c, cells were coincubated with CRP and annexin V–FITC (green) to compare the patterns of staining between CRP and annexin V. In d, apoptotic cells were permeabilized before incubation with CRP and anti-CRP so as to compare the patterns of binding to apoptotic cells that were not permeabilized (b and e) before exposure to CRP. In e and f, nonpermeabilized (e) or permeabilized (f) apoptotic cells were incubated with 50 μg/ml CRP and an anti-Sm/RNP–containing antiserum (1:200 dilution). Sm/RNP antibodies were detected using FITC-conjugated goat anti–human IgG (green). Colocalization of snRNP and CRP appears yellow. Confocal images a and c are projections of a stack of 12 slices, and b is a single optical slice at ×64 magnification. Magnification for immunofluorescence is ×60. In c, inset = ×224.
Figure 3
Figure 3
CRP enhances the deposition of early components of complement yet protects apoptotic cells against the formation of the MAC. Apoptotic Jurkat cells were incubated with 20% NHS or HIS for the times shown in the presence (+CRP) or absence of 50 μg/ml CRP. The percentage of cells positive for C1q staining is shown in A and reflects the mean ± SE of three experiments. An IgM anti–β2-microglobulin antibody (+Ab) was used as a positive control for C1q binding to live Jurkat cells in NHS. Representative flow cytometry histograms of changes in the binding of C1q, C3b/bi, and MAC to apoptotic cells in the presence or absence of 50 μg/ml CRP are shown in B, and the results of 6–10 experiments are summarized in C. The results in C (mean ± SD) are presented as the percentage of cells that bound the complement factors in the presence of CRP as compared with binding in the control (20% NHS without added CRP). *P = 0.03; **P < 0.05; ***P < 0.0001 compared with control without added CRP.
Figure 3
Figure 3
CRP enhances the deposition of early components of complement yet protects apoptotic cells against the formation of the MAC. Apoptotic Jurkat cells were incubated with 20% NHS or HIS for the times shown in the presence (+CRP) or absence of 50 μg/ml CRP. The percentage of cells positive for C1q staining is shown in A and reflects the mean ± SE of three experiments. An IgM anti–β2-microglobulin antibody (+Ab) was used as a positive control for C1q binding to live Jurkat cells in NHS. Representative flow cytometry histograms of changes in the binding of C1q, C3b/bi, and MAC to apoptotic cells in the presence or absence of 50 μg/ml CRP are shown in B, and the results of 6–10 experiments are summarized in C. The results in C (mean ± SD) are presented as the percentage of cells that bound the complement factors in the presence of CRP as compared with binding in the control (20% NHS without added CRP). *P = 0.03; **P < 0.05; ***P < 0.0001 compared with control without added CRP.
Figure 4
Figure 4
Protection from complement-mediated lysis requires FH recruitment by CRP. Apoptotic Jurkat cells were incubated with 20% NHS, C1qd serum, or FH-deficient (FHlo) serum for 30 min in the presence or absence of 50 μg/ml CRP. In A, FH binding (155 kD) was detected by Western blotting using anti-FH antiserum, biotinylated anti–sheep IgG, and ECL reagents. Protein loading between lanes was compared by Western blotting the same membrane with antiribosomal P antiserum (P0 is 38 kD). The roles of CRP, C1q, and FH on the percentage of apoptotic cells binding FH (B) and the MAC (E) were determined by flow cytometric analysis. The mean ± SE of three experiments is presented. Where indicated by +, CRP was added to a concentration of 50 μg/ml or FH was added back to FHlo serum to a concentration of 50 μg/ml. (C) To determine whether CRP could recruit FH in the absence of C3b or other serum factors, apoptotic Jurkat cells were incubated with purified CRP (0.5 μg/ml, thin line, or 50 μg/ml, thick line), washed, and then incubated with purified FH (50 μg/ml). The cells were washed and stained with isotype control (dotted lines), anti-CRP (left panel), or anti-FH (right panel) and analyzed by flow cytometry. (D) Flow cytometric analysis of apoptotic Jurkat cells incubated with FHlo serum demonstrating C3b/bi binding (thick line) as compared with normal serum (thin line) and isotype control (dotted line). In F, apoptotic Jurkat T cells were incubated with PI in the presence of NHS (thick line) or FHlo serum (thin line). The experiments in the left panel were performed without added CRP and those on the right with 50 μg/ml CRP. PI staining was quantified by flow cytometry.
Figure 5
Figure 5
CRP enhances phagocytosis of apoptotic cells. TAMRA-labeled apoptotic Jurkat cells were incubated with 50 μg/ml CRP and/or 20% HIS, NHS, C1qd, or FHlo human serum for 30 min. The cells were washed in serum-free medium and then incubated with human macrophages at a ratio of 5:1 for 1 h in the absence of serum. The macrophages were disadhered and then labeled with an anti-CD14 mAb and analyzed by flow cytometry. The results are expressed as the percentage of macrophages that bound or internalized TAMRA-positive cells. A representative experiment is shown in A, and a summary (mean ± SE of four experiments) is shown in B. *C1q reconstituted.
Figure 5
Figure 5
CRP enhances phagocytosis of apoptotic cells. TAMRA-labeled apoptotic Jurkat cells were incubated with 50 μg/ml CRP and/or 20% HIS, NHS, C1qd, or FHlo human serum for 30 min. The cells were washed in serum-free medium and then incubated with human macrophages at a ratio of 5:1 for 1 h in the absence of serum. The macrophages were disadhered and then labeled with an anti-CD14 mAb and analyzed by flow cytometry. The results are expressed as the percentage of macrophages that bound or internalized TAMRA-positive cells. A representative experiment is shown in A, and a summary (mean ± SE of four experiments) is shown in B. *C1q reconstituted.
Figure 6
Figure 6
Phagocytosis of CRP-adherent apoptotic cells maintains TGF-β production in the presence of early complement components. Apoptotic or necrotic Jurkat cells were preincubated with the components indicated for 30 min and then incubated with macrophages in medium containing 10% FBS overnight. The supernatants were collected, and the concentrations of TNF-α and TGF-β were quantified by ELISA. The results are presented as the mean ± SE of triplicates and are representative of three independent experiments.

References

    1. Ren Y., Savill J. Apoptosisthe importance of being eaten. Cell. Death. Differ. 1998;5:563–568. - PubMed
    1. Gregory C.D. CD14-dependent clearance of apoptotic cellsrelevance to the immune system. Curr. Opin. Immunol. 2000;12:27–34. - PubMed
    1. Gewurz H., Mold C., Siegel J., Fiedel B. C-reactive protein and the acute phase response. Adv. Int. Med. 1982;27:345–372. - PubMed
    1. Steel D.M., Whitehead A.S. The major acute phase reactantsC-reactive protein, serum amyloid P component and serum amyloid A protein. Immunol. Today. 1994;15:81–88. - PubMed
    1. Szalai A.J., Agrawal A., Greenhough T.J., Volanakis J.E. C-reactive protein. Structural biology, gene expression and host defense function. Immunol. Res. 1997;16:127–136. - PubMed

Publication types

MeSH terms