

Independent and combined analyses of sequences from all three genomic compartments converge on the root of flowering plant phylogeny
- PMID: 11069280
- PMCID: PMC27196
- DOI: 10.1073/pnas.220427497
Independent and combined analyses of sequences from all three genomic compartments converge on the root of flowering plant phylogeny
Abstract
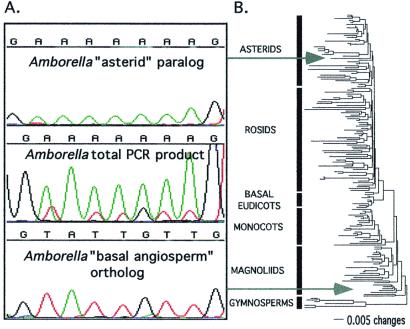
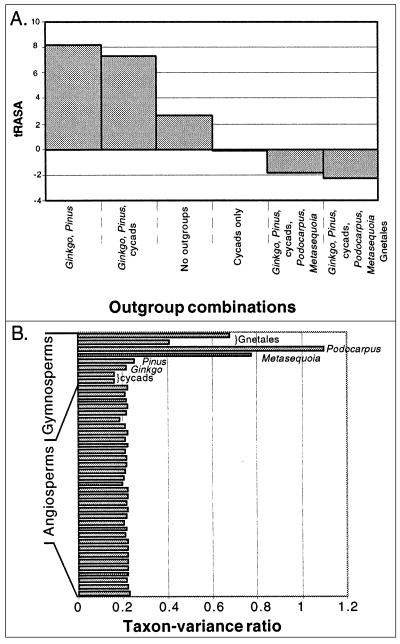
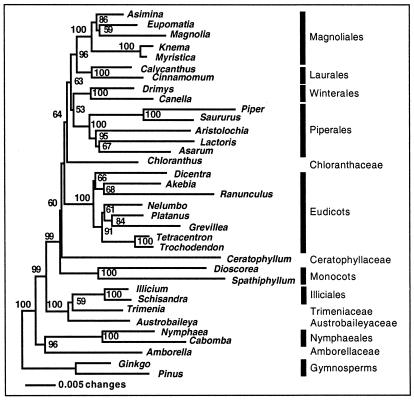
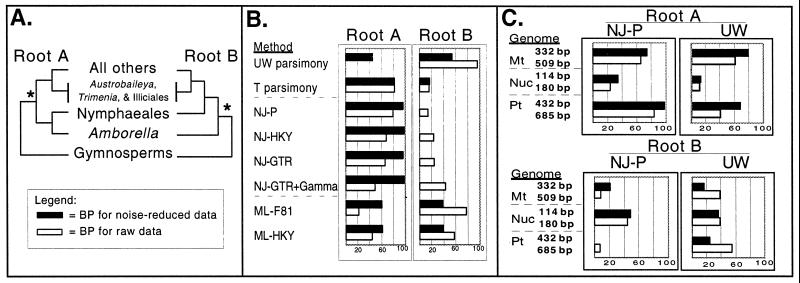
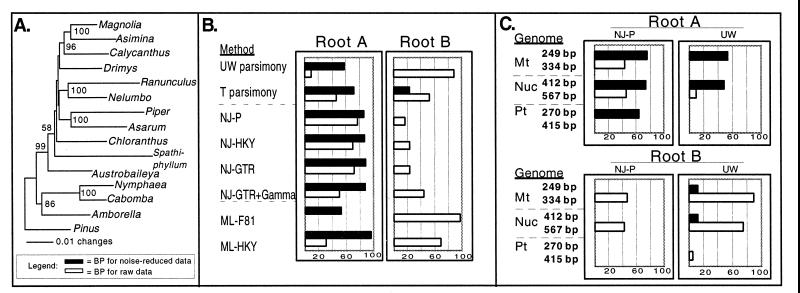
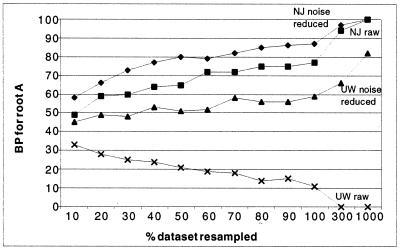
Plant phylogenetic estimates are most likely to be reliable when congruent evidence is obtained independently from the mitochondrial, plastid, and nuclear genomes with all methods of analysis. Here, results are presented from separate and combined genomic analyses of new and previously published data, including six and nine genes (8, 911 bp and 12,010 bp, respectively) for different subsets of taxa that suggest Amborella + Nymphaeales (water lilies) are the first-branching angiosperm lineage. Before and after tree-independent noise reduction, most individual genomic compartments and methods of analysis estimated the Amborella + Nymphaeales basal topology with high support. Previous phylogenetic estimates placing Amborella alone as the first extant angiosperm branch may have been misled because of a series of specific problems with paralogy, suboptimal outgroups, long-branch taxa, and method dependence. Ancestral character state reconstructions differ between the two topologies and affect inferences about the features of early angiosperms.
Figures
Comment in
-
Progress in understanding angiosperm history, success, and relationships: Darwin's abominably "perplexing phenomenon".Proc Natl Acad Sci U S A. 2000 Nov 21;97(24):12939-41. doi: 10.1073/pnas.97.24.12939. Proc Natl Acad Sci U S A. 2000. PMID: 11087846 Free PMC article. Review. No abstract available.
References
-
- Darwin C. In: More Letters of Charles Darwin: A Record of His Work in a Series of Hitherto Unpublished Letters. Darwin F, Seward A C, editors. Vol. 2. London: John Murray; 1903.
-
- Crane P R, Fris E M, Pedersen K R. Nature (London) 1995;374:27–33.
-
- Doyle J A. Mol Phylogenet Evol. 1998;9:448–462. - PubMed
-
- Carmichael J S, Friedman W E. Am J Bot. 1996;83:767–780.
Publication types
MeSH terms
Associated data
- Actions
- Actions
- Actions
- Actions
- Actions
- Actions
- Actions
- Actions
- Actions
- Actions
- Actions
- Actions
- Actions
- Actions
- Actions
- Actions
- Actions
- Actions
- Actions
- Actions
- Actions
- Actions
- Actions
- Actions
- Actions
- Actions
- Actions
- Actions
- Actions
- Actions
LinkOut - more resources
Full Text Sources
