. 2000 Nov 15;20(22):8607-13.
doi: 10.1523/JNEUROSCI.20-22-08607.2000.

Avoidance task training potentiates phasic pontine-wave density in the rat: A mechanism for sleep-dependent plasticity

Affiliations

Avoidance task training potentiates phasic pontine-wave density in the rat: A mechanism for sleep-dependent plasticity

S Datta. J Neurosci. .

Abstract

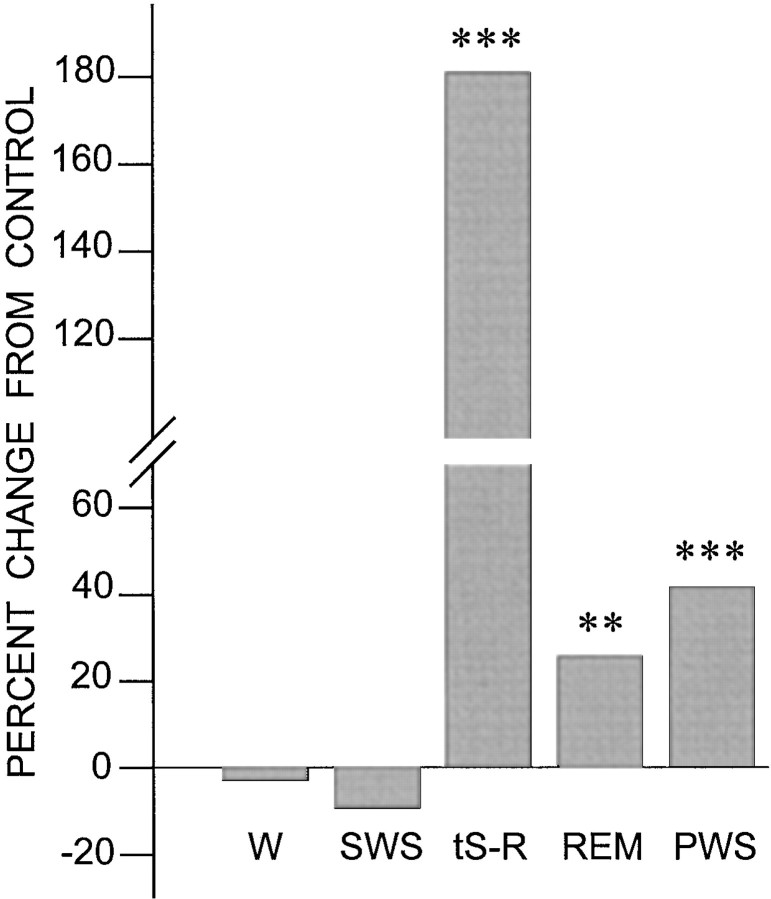
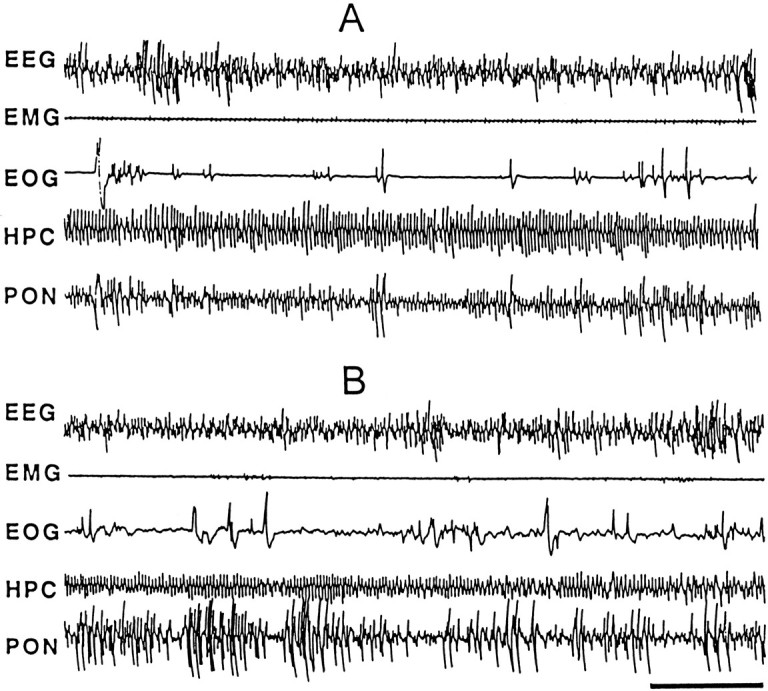
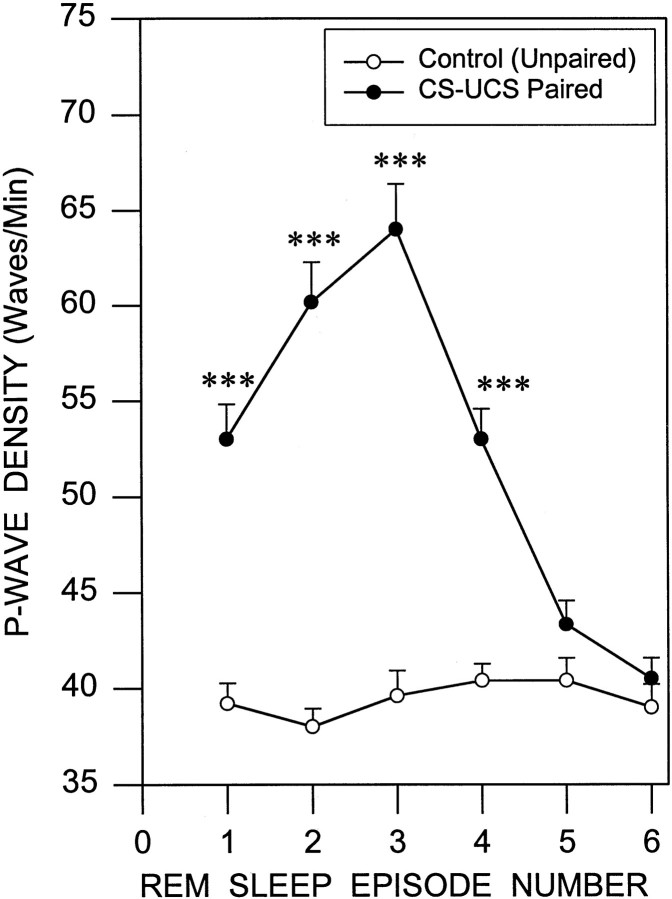
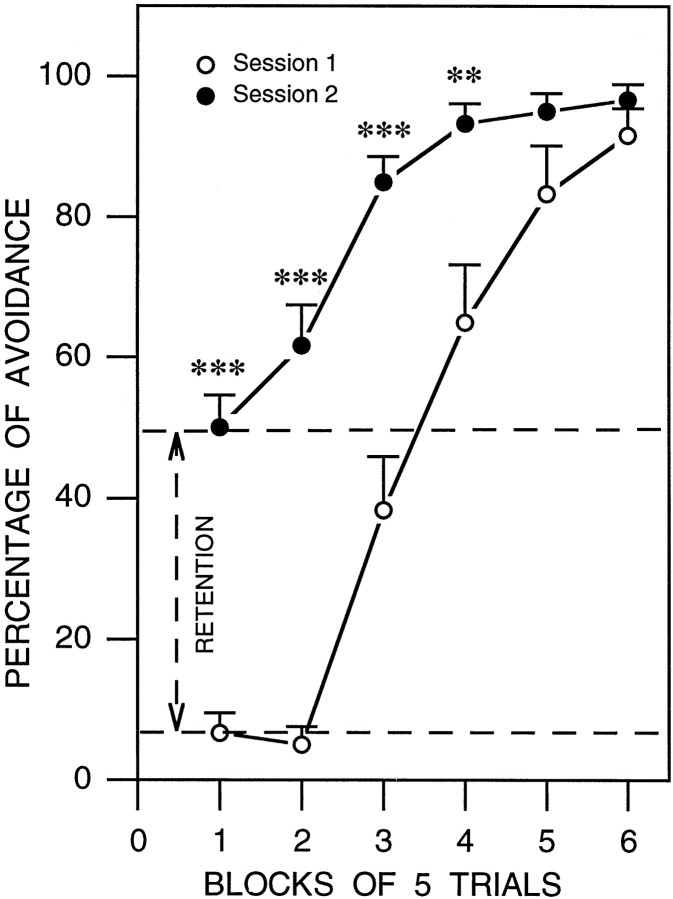
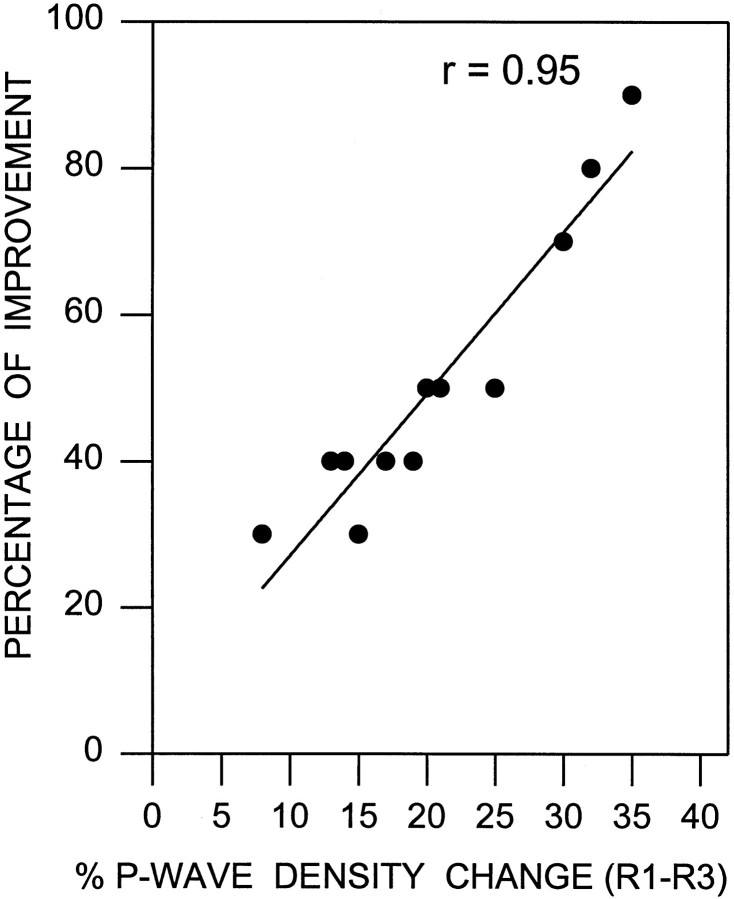
Behavioral studies of learning and memory in both humans and animals support a role for sleep in the consolidation and integration of memories. The present study explored possible physiological mechanisms of sleep-dependent behavioral plasticity by examining the relationship between learning and state-dependent phasic signs of rapid eye movement (REM) sleep. Cortical electroencephalogram, electromyogram, eye movement, hippocampal theta-wave, and pontine-wave (P-wave) measures were recorded simultaneously in freely moving rats after a session of conditioned avoidance learning or a control session. After learning trials, rats spent 25.5% more time in REM sleep and 180.6% more time in a transitional state between slow-wave sleep and REM sleep (tS-R) compared with that in control trials. Both REM sleep and tS-R behavioral states are characterized by the presence of P-waves. P-wave density was significantly greater in the first four episodes of REM sleep after the learning session compared with the control session. Furthermore, the P-wave density change between the first and third REM sleep episodes was proportional to the improvement of task performance between the initial training session and the post-sleep retest session. These findings show that the increase in P-wave density during the post-training REM sleep episodes is correlated with the effective consolidation and retention of avoidance task learning.


Figures

Fig. 1.
Fig. 1.
Effects of learning trials compared with control trials on wakefulness and different sleep states. Percentage changes in wakefulness (W), slow-wave sleep (SWS), transition from slow-wave sleep to REM sleep (tS-R), REM sleep (REM), and total P-wave state (PWS; combined tS-R andREM) from the first session of control trials (0 line) to the first session of learning trials (CS–UCS paired). Note that the percentage of change from the control trials (CS–UCS unpaired) in W and SWSafter the learning trials (CS–UCS paired) is not significant. However, the learning trials significantly increased the percentage oftS-R, REM, and PWS from the control trials. Post hoct tests: **p < 0.01; ***p < 0.001.
Fig. 2.
Fig. 2.
Sample polygraphic appearance of the third episode of REM sleep after the first session of control trials (A) and learning trials (B). Note the qualitative similarity in both records showing characteristic electrographic signs of REM sleep: low-voltage, high-frequency, or desynchronized waves recorded from the frontal cortex (EEG); muscle atonia (EMG); rapid eye movements (EOG); hippocampal θ waves in the hippocampal EEG(HPC); and P-waves (spiky waves) in the pontineEEG (PON). Despite qualitative similarity, P-waves are more frequent in the learning trials than in the control trials. Time scale, 5 sec.
Fig. 3.
Fig. 3.
Increased P-wave density in the first four episodes of REM sleep after a session of learning trials. This line graph illustrates P-wave density (mean ± SE) in the first six episodes of REM sleep after a session of the control trials (empty circles) and learning trials (filled circles). Note that the P-wave density in the first four episodes of REM sleep is significantly higher after the learning trials compared with the control trials. Also note that the P-wave density sharply increased from the first episode of REM sleep to the third episode in which it peaked and then started to decline toward the baseline density level. Post hoc t tests: ***p < 0.001.
Fig. 4.
Fig. 4.
Learning curves in session 1 (empty circles) and session 2 (filled circles) for the two-way active avoidance task. The percentage of avoidance learning (mean ± SE) is plotted here in blocks of five trials. Note that in the first session the rats (n = 12) performed poorly in the first two blocks of trials (10 trials) and then in the third block the animals started to avoid. By the sixth block the animals successfully avoided in >80% of the trials. After the first session the animals were allowed 6 hr of undisturbed sleep. After sleep, the animals were subjected to the second session of active avoidance trials. Unlike in the first session, during the first two blocks of the second session, animals avoided in >50% of the trials. These data indicate the improvement in the avoidance learning (or retention) between session 1 and session 2. By the third block of trials animals avoided in >80% of the trials. Post hoc t test: **p < 0.01; ***p < 0.001.
Fig. 5.
Fig. 5.
Relationship between the P-wave density change and the improvement in learning. The percentage of improvement for each animal (filled circles) is shown as a function of the percentage of P-wave density change between the first (R1) and third (R3) episodes of REM sleep after the first session of active avoidance learning trials (n = 12 rats). The percentage of improvement was calculated by subtracting the percentage of avoidance in the first two blocks of the first session of learning trials from the percentage of the first two blocks in the second session. The plot of linear regression best-fit (solid line; Pearson product–moment correlation) shows a statistically significant positive slope (r = 0.95; p < 0.001). These data indicate that the level of improvement of learning in the retrial session depends positively on the percentage of the P-wave density increase in between the first and third episodes of REM sleep immediately after the first session of learning trials.

References

    1. Albert IB, Cicala GA, Siegal J. The behavioral effects of REM sleep deprivation in rats. Psychophysiology. 1970;6:550–560. - PubMed
    1. Ambrosini MV, Sadile AG, Gironi Carnevale UA, Mattiaccio A, Giuditta A. The sequential hypothesis on sleep function. II. A correlative study between sleep variables and newly synthesized brain DNA. Physiol Behav. 1988;43:339–350. - PubMed
    1. Bliss TVP, Collingridge GL. A synaptic model of memory: long-term potentiation in the hippocampus. Nature. 1993;361:31–39. - PubMed
    1. Bloch V, Laroche S. Conditioning of hippocampal cells: its acceleration and long-term facilitation by post-trial reticular stimulation. Behav Brain Res. 1981;3:23–42. - PubMed
    1. Bloch V, Laroche S. Facts and hypotheses related to the search for the engram. In: Lynch G, McGaugh JL, Weinberger NM, editors. Neurobiology of learning and memory. Guilford; New York: 1984. pp. 249–260.

Publication types

LinkOut - more resources