. 2000 Nov 7;97(23):12694-9.
doi: 10.1073/pnas.97.23.12694.

Coexpression of the chemokines ELC and SLC by T zone stromal cells and deletion of the ELC gene in the plt/plt mouse

Affiliations

Coexpression of the chemokines ELC and SLC by T zone stromal cells and deletion of the ELC gene in the plt/plt mouse

S A Luther et al. Proc Natl Acad Sci U S A. .

Abstract

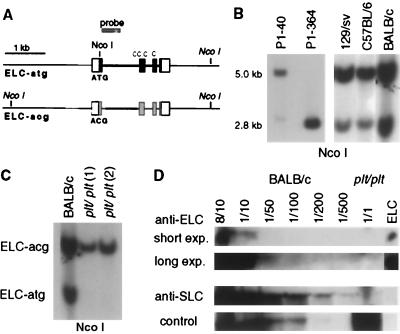
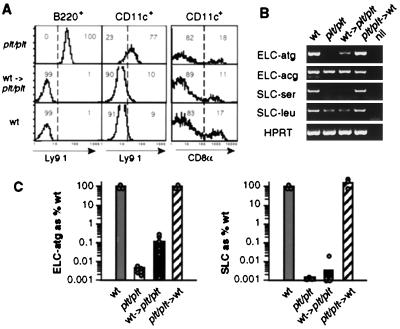
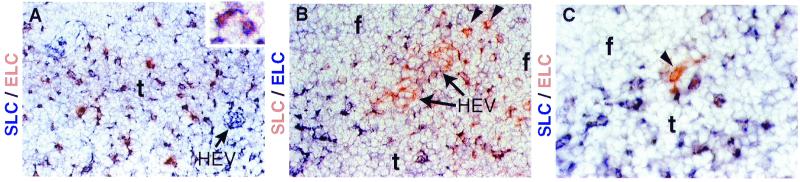
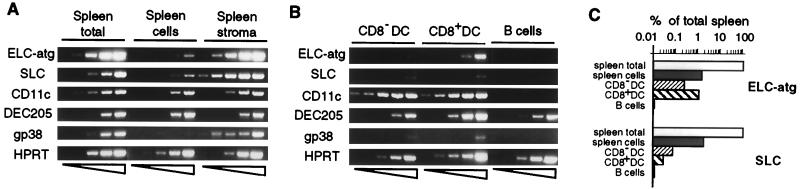
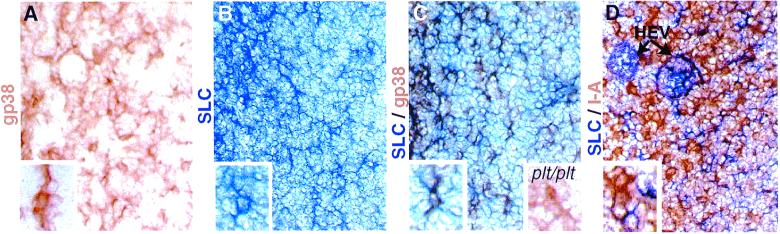
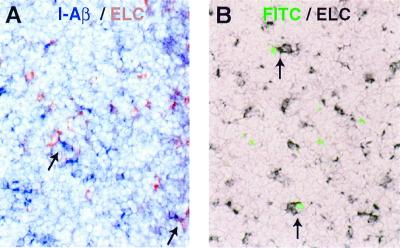
The spontaneous mutant mouse strain, plt/plt, lacks the secondary lymphoid organ chemokine (SLC)-ser gene and has disrupted trafficking of T cells and dendritic cells (DCs) to lymphoid tissues. We demonstrate here that the gene for the related chemokine, Epstein-Barr virus-induced molecule-1 ligand chemokine (ELC), is also deleted in this immunodeficient mouse strain. Using a combination of approaches, including bone marrow reconstitution and double in situ hybridization, we show in wild-type mice that ELC is expressed by T zone stromal cells that also make SLC. Smaller amounts of ELC are made by DCs, predominantly of the CD8(+) phenotype. We propose that ELC- and SLC-expressing T zone stromal cells play a central role in bringing naive T cells and DCs together for the initiation of immune responses.


Figures

Figure 1
Figure 1
Genomic analysis of the murine ELC locus shows the presence of one ELC-atg gene and several ELC-acg genes and deletion of the ELC-atg gene in plt/plt mice. (A) Genomic organization of ELC-atg and ELC-acg genes. White boxes show 5′- and 3′-untranslated sequences, black boxes the coding sequence for ELC-atg, and gray boxes the corresponding regions of ELC-acg. The positions of NcoI restriction sites are indicated, with the location of sites in italics based upon Southern blot analysis only. (B) Southern blot of NcoI-digested P1 DNA and mouse genomic DNA to identify ELC-atg (≈2.8 kb) and ELC-acg genes (≈5.0 kb). (C) plt/plt mice lack the ELC-atg gene. Southern blot of NcoI-digested DNA from one BALB/c and two plt/plt mice. The probe used in B and C is indicated in A. (D) Western blot of extracts from pooled LNs and spleen from wild-type (BALB/c) or plt/plt mice, probed with antibodies to ELC or SLC. Extracts from BALB/c mice were titrated from 8 of 10 (80%) to 1 of 500 (0.2%). Short and long exposures of the anti-ELC probed blot are shown. A nonspecific high molecular weight band detected with the anti-ELC serum is shown as a loading control.
Figure 2
Figure 2
Partial restoration of ELC but not SLC mRNA expression in spleen of plt/plt mice that have been reconstituted with wild-type bone marrow. (A) Flow cytometric analysis of splenocytes from Ly9.1+ plt/plt mice, Ly9.1 B10D2 wild-type mice (wt), or irradiated plt/plt mice that had been reconstituted with wild-type bone marrow (wt →plt/plt). Left histograms show Ly9.1 on B cells (B220+), and central histograms show Ly9.1 on DCs (CD11c+B220CD3). Right histograms display the proportions of CD11c+ cells that express CD8α. Numbers indicate the percentage of cells in the gated population. The data are representative of at least four mice of each type. (B) RT-PCR analysis of ELC and SLC mRNA expression in spleen of wild-type (wt), plt/plt, and bone marrow chimeric mice. Total spleen RNA from the indicated mice was analyzed by RT-PCR with primers specific for ELC-atg, ELC-acg, SLC-ser, SLC-leu, and HPRT. (C) Real-time quantitative RT-PCR analysis of ELC-atg and total SLC expression in samples of the same type as in B. Each dot represents an individual mouse, and bars represent the mean.
Figure 3
Figure 3
Coexpression of ELC and SLC in LN T zone. (A–C) Bright-field micrographs showing hybridization of mouse LN with the following antisense probes: (A and C) DIG-labeled SLC probe (blue) and FITC-labeled ELC probe (red); (B) DIG-labeled ELC probe (blue) and FITC-labeled SLC probe (red). Inset in A shows examples of ELC/SLC double-positive cells. In B and C, the blue reaction product is overdeveloped so that double-positive cells are not visible, but red single-positive cells are apparent. f, follicle; t, T zone. Arrowheads show examples of single-positive cells. (Magnification: A and B, ×20; C, ×40.)
Figure 4
Figure 4
ELC and SLC mRNA expression in spleen stromal cells and DCs. (A and B) Semiquantitative RT-PCR for the indicated transcripts using RNA extracted from the following: (A) total spleen tissue, a suspension of spleen cells obtained after mechanical mashing of spleen through a cell strainer and the remaining nonsuspendable fraction (spleen stroma); (B) sorted CD8α and CD8α+ DCs (CD11c+B220CD3) and sorted B cells (B220+). In A and B, serial 1:5 dilutions of each cDNA sample were used as template in PCR. (C) Quantitative RT-PCR analysis of ELC-atg and SLC expression in samples prepared as in A and B. Expression is plotted as % of corresponding mRNA in the total spleen.
Figure 5
Figure 5
Distribution of SLC protein with respect to stromal cells and DCs. Immunohistochemistry on serial C57BL/6 LN sections for the stromal cell marker gp38 (A and C, in brown), for SLC (B, C, and D, in blue), or for I-A (D, in brown). Insets in lower left of each image show enlarged views of cells from the same tissue section. Inset in lower right of C shows a region of plt/plt LN stained identically to the wild-type tissue section shown in this panel. (Magnification: ×20.)
Figure 6
Figure 6
Close proximity of ELC-producing cells and DCs. (A) Double in situ hybridization of LN for I-Aβ (blue) and ELC (red). (B) Section from the draining LN of a FITC skin-painted mouse, taken at day 1 after painting. Newly immigrated DCs are identified by strong intracellular FITC fluorescence (green) and ELC mRNA-expressing cells by in situ hybridization (black). Arrows show examples of colocalizing cells. (Magnification, ×20.)

Similar articles

Cited by

References

    1. Zlotnik A, Yoshie O. Immunity. 2000;12:121–127. - PubMed
    1. Förster R, Schubel A, Breitfeld D, Kremmer E, Renner-Muller I, Wolf E, Lipp M. Cell. 1999;99:23–33. - PubMed
    1. Gunn M D, Kyuwa S, Tam C, Kakiuchi T, Matsuzawa A, Williams L T, Nakano H. J Exp Med. 1999;189:451–460. - PMC - PubMed
    1. Cyster J G. Science. 1999;286:2098–2102. - PubMed
    1. Zlotnik A, Morales J, Hedrick J A. Crit Rev Immunol. 1999;19:1–47. - PubMed

Publication types

Associated data

LinkOut - more resources