

Identification of alternative splicing and negative splicing activity of a nonsegmented negative-strand RNA virus, Borna disease virus
- PMID: 11070091
- PMCID: PMC18842
- DOI: 10.1073/pnas.97.23.12788
Identification of alternative splicing and negative splicing activity of a nonsegmented negative-strand RNA virus, Borna disease virus
Abstract
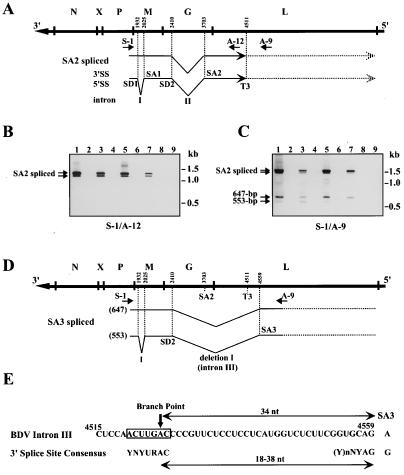
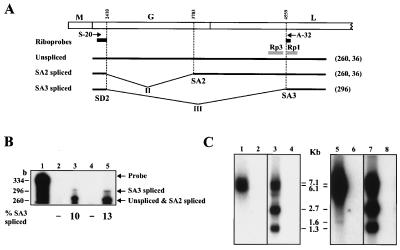
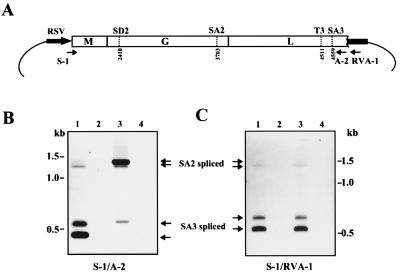
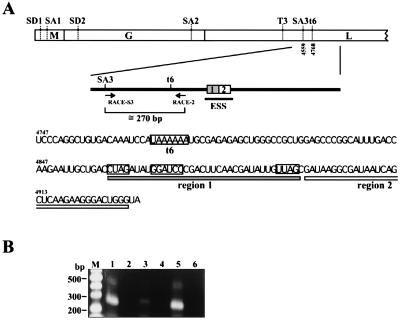
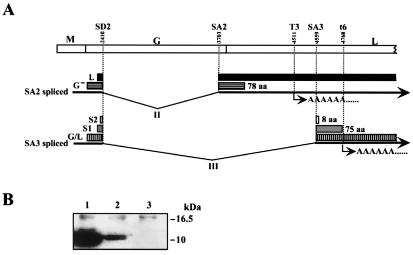
Borna disease virus (BDV) is a nonsegmented negative-strand RNA virus that belongs to the Mononegavirales. Unlike other animal viruses of this order, BDV replicates and transcribes in the nucleus of infected cells. Previous studies have shown that BDV uses RNA splicing machinery for its mRNA expression. In the present study, we identified spliced RNAs that use an alternative 3' splice site, SA3, in BDV-infected cell lines as well as infected animal brain cells. Transient transfection analysis of cDNA clones of BDV RNA revealed that although SA3 is a favorable splice site in mammalian cells, utilization of SA3 is negatively regulated in infected cells. This negative splicing activity of the SA3 site is regulated by a putative cis-acting region, the exon splicing suppressor (ESS), within the polymerase exon of BDV. The BDV ESS contains similar motifs to other known ESSs present in viral and cellular genes. Furthermore, our results indicated that a functional polyadenylation signal just upstream of the BDV ESS is also involved in the regulation of alternative splicing of BDV. These observations represent the first documentation of complex RNA splicing in animal RNA viruses and also provide new insight into the mechanism of regulation of alternative splicing in animal viruses.
Figures
Similar articles
-
Translation initiation of a bicistronic mRNA of Borna disease virus: a 16-kDa phosphoprotein is initiated at an internal start codon.Virology. 2000 Nov 25;277(2):296-305. doi: 10.1006/viro.2000.0592. Virology. 2000. PMID: 11080477
-
A methionine-rich domain mediates CRM1-dependent nuclear export activity of Borna disease virus phosphoprotein.J Virol. 2006 Feb;80(3):1121-9. doi: 10.1128/JVI.80.3.1121-1129.2006. J Virol. 2006. PMID: 16414989 Free PMC article.
-
Novel insights into the regulation of the viral polymerase complex of neurotropic Borna disease virus.Virus Res. 2005 Aug;111(2):148-60. doi: 10.1016/j.virusres.2005.04.006. Virus Res. 2005. PMID: 15992626 Review.
-
The remarkable coding strategy of borna disease virus: a new member of the nonsegmented negative strand RNA viruses.Virology. 1995 Jun 20;210(1):1-8. doi: 10.1006/viro.1995.1311. Virology. 1995. PMID: 7793061 Review.
-
Modulation of Borna disease virus phosphoprotein nuclear localization by the viral protein X encoded in the overlapping open reading frame.J Virol. 2003 Jul;77(14):8099-107. doi: 10.1128/jvi.77.14.8099-8107.2003. J Virol. 2003. PMID: 12829848 Free PMC article.
Cited by
-
Circular RNAs: New Epigenetic Signatures in Viral Infections.Front Microbiol. 2020 Jul 31;11:1853. doi: 10.3389/fmicb.2020.01853. eCollection 2020. Front Microbiol. 2020. PMID: 32849445 Free PMC article. Review.
-
MAASE: an alternative splicing database designed for supporting splicing microarray applications.RNA. 2005 Dec;11(12):1767-76. doi: 10.1261/rna.2650905. Epub 2005 Oct 26. RNA. 2005. PMID: 16251387 Free PMC article.
-
Identification of splicing silencers and enhancers in sense Alus: a role for pseudoacceptors in splice site repression.Mol Cell Biol. 2005 Aug;25(16):6912-20. doi: 10.1128/MCB.25.16.6912-6920.2005. Mol Cell Biol. 2005. PMID: 16055705 Free PMC article.
-
ORF Ι of Mycovirus SsNSRV-1 is Associated with Debilitating Symptoms of Sclerotinia sclerotiorum.Viruses. 2020 Apr 17;12(4):456. doi: 10.3390/v12040456. Viruses. 2020. PMID: 32316519 Free PMC article.
-
RNA splicing in a new rhabdovirus from Culex mosquitoes.J Virol. 2011 Jul;85(13):6185-96. doi: 10.1128/JVI.00040-11. Epub 2011 Apr 20. J Virol. 2011. PMID: 21507977 Free PMC article.
References
Publication types
MeSH terms
Substances
LinkOut - more resources
Full Text Sources
