. 2000 Nov 7;97(23):12846-51.
doi: 10.1073/pnas.97.23.12846.

Neural stem cells display extensive tropism for pathology in adult brain: evidence from intracranial gliomas

Affiliations

Neural stem cells display extensive tropism for pathology in adult brain: evidence from intracranial gliomas

K S Aboody et al. Proc Natl Acad Sci U S A. .

Erratum in

  • Proc Natl Acad Sci U S A 2001 Jan 16;98(2):777

Abstract

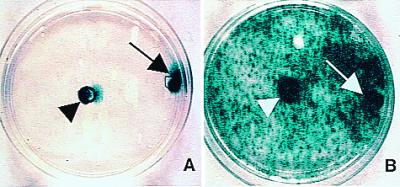
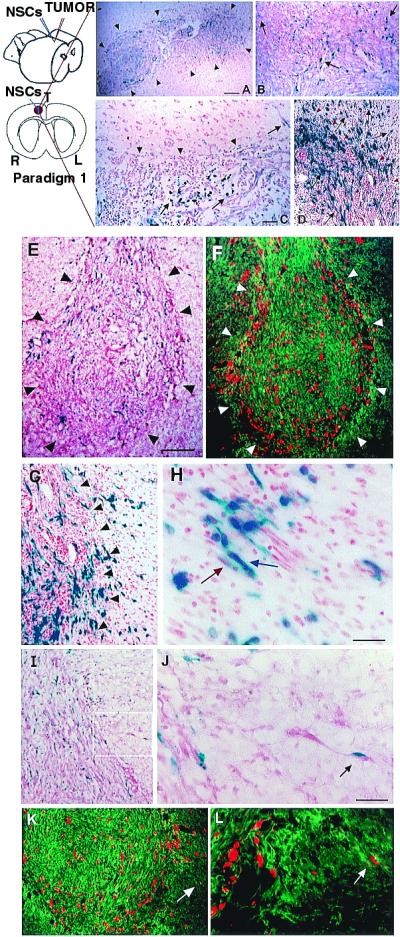
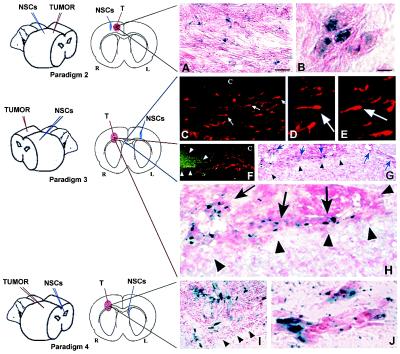
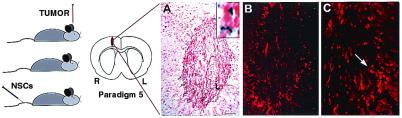
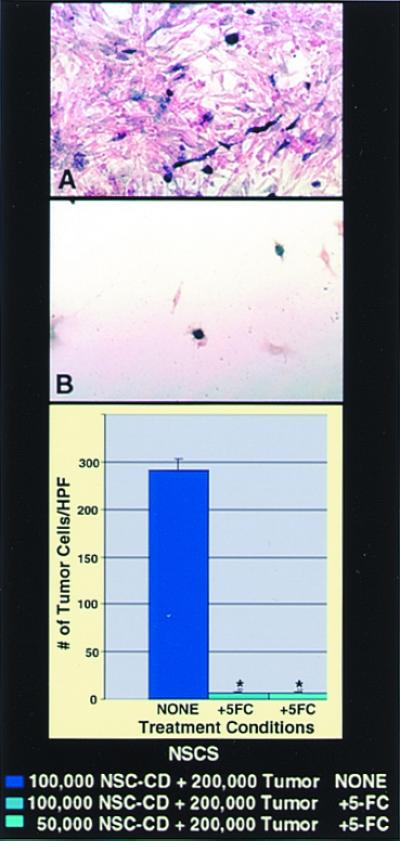
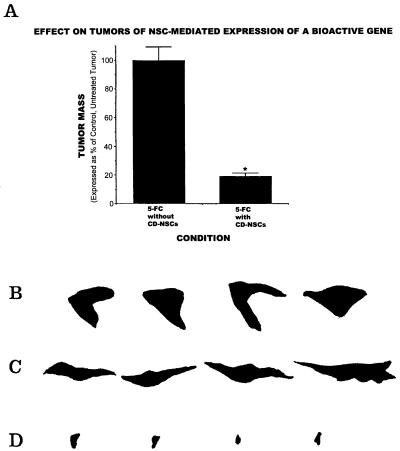
One of the impediments to the treatment of brain tumors (e.g., gliomas) has been the degree to which they expand, infiltrate surrounding tissue, and migrate widely into normal brain, usually rendering them "elusive" to effective resection, irradiation, chemotherapy, or gene therapy. We demonstrate that neural stem cells (NSCs), when implanted into experimental intracranial gliomas in vivo in adult rodents, distribute themselves quickly and extensively throughout the tumor bed and migrate uniquely in juxtaposition to widely expanding and aggressively advancing tumor cells, while continuing to stably express a foreign gene. The NSCs "surround" the invading tumor border while "chasing down" infiltrating tumor cells. When implanted intracranially at distant sites from the tumor (e.g., into normal tissue, into the contralateral hemisphere, or into the cerebral ventricles), the donor cells migrate through normal tissue targeting the tumor cells (including human glioblastomas). When implanted outside the CNS intravascularly, NSCs will target an intracranial tumor. NSCs can deliver a therapeutically relevant molecule-cytosine deaminase-such that quantifiable reduction in tumor burden results. These data suggest the adjunctive use of inherently migratory NSCs as a delivery vehicle for targeting therapeutic genes and vectors to refractory, migratory, invasive brain tumors. More broadly, they suggest that NSC migration can be extensive, even in the adult brain and along nonstereotypical routes, if pathology (as modeled here by tumor) is present.


Figures

Figure 1
Figure 1
Migratory capacity of NSCs in culture. CNS-1 glioblastoma cells were plated around a central cylinder (i.e., free of CNS-1 cells). Fibroblasts (A) or NSCs (B) were seeded into the center cylinder (i.e., no direct contact with CNS-1 cells) (arrowheads) or into cylinders placed directly on top of adherent tumor cells (at the extreme right edge of plates; arrows). After removal of the cylinders and 5 additional days of incubation, there was wide distribution of blue X-Gal+ NSCs (B), compared with fibroblasts (A), which remained localized to their area of initial seeding.
Figure 2
Figure 2
NSCs migrate extensively throughout a brain tumor mass in vivo and “trail” advancing tumor cells. Paradigm 1 is illustrated schematically. Section of brain under low (A) and high (B) power from an adult rat killed 48 h after NSC injection into an established D74 glioma, processed with X-Gal to detect blue-staining β-gal-producing NSCs and counterstained with neutral red to show dark red tumor cells; arrowheads demarcate approximate edges of the tumor mass where it interfaces with normal tissue. Donor X-Gal+ blue NSCs (arrows) can be seen extensively distributed throughout the mass, interspersed among the red tumor cells. (C) Tumor, 10 days after NSC injection, illustrating that, although NSCs (arrows) have infiltrated the mass, they largely stop at the junction between tumor and normal tissue (arrowheads) except where a tumor cell (dark red, elongated) is entering normal tissue; then NSCs appear to “follow” the invading tumor cell into surrounding tissue (upper right arrow). This phenomenon becomes more dramatic when examining NSC behavior in a more virulent and aggressively invasive tumor, the CNS-1 glioblastoma in the adult nude mouse, pictured in D. This section illustrates extensive migration and distribution of blue NSCs (arrows) throughout the infiltrating glioblastoma up to and along the infiltrating tumor edge (red arrowheads) and into surrounding tissue in juxtaposition to many dark red+ tumor cells invading normal tissue. The “tracking” of individual glioblastoma cells is examined in greater detail in E–L, where CNS-1 cells have been labeled ex vivo by transduction with GFP cDNA. (E and F) Sister sections showing a low power view of transgene-expressing NSCs distributed throughout the main tumor mass to the tumor edge (outlined by arrowheads). Sections were either costained with X-Gal (NSCs, blue) and neutral red (tumor cells, dark red and elongated) (E) or processed for double immunofluorescence using an anti-β-gal antibody (NSCs, red) and an FITC-conjugated anti-GFP antibody (glioblastoma cells, green) (F). Low (G) and high (H) power views of tumor edge (arrowheads) with blue NSCs (blue arrow) in immediate proximity to and intermixed with an invading tumor “island” (dark red spindle-shaped cells) (red arrow). (I and J) Low and high power views, respectively (boxed area in I is magnified in J), of a blue NSC in direct juxtaposition to a single migrating neutral red+, spindle-shaped tumor cell (arrow), the NSC “riding” the glioma cell in “piggy-back” fashion. (K and L) Low and high power views, respectively, under fluorescence microscopy, of single migrating GFP+ tumor cells (green) in juxtaposition to β-gal+ NSCs (red). Region indicated by white arrow in K and magnified in L illustrates NSCs apposed to tumor cells migrating away from the main tumor bed. (Scale bars: A, 40 μm, 30 μm in B; C, 30 μm, 25 μm in D; E, 90 μm, 100 μm in F; H, 15 μm, 60 μm in G; J, 30 μm, 60 μm in I, 70 μm in K, 35 μm in L.)
Figure 3
Figure 3
NSCs implanted at various intracranial sites distant from main tumor bed migrate through normal adult tissue toward glioma cells. (A and B) Same hemisphere but behind tumor (Paradigm 2). Shown here is a section through the tumor from an adult nude mouse 6 days after NSC implantation caudal to tumor. In A (as per the schematic, a coned down view of a tumor populated as pictured under low power in Figs. 2A and 3 A and B), note X-Gal+ blue NSCs interspersed among dark neutral red+ tumor cells. (B) High power view of NSCs in juxtaposition to islands of tumor cells. (C–H) Contralateral hemisphere (Paradigm 3). (C–E) As indicated on the schematic, these panels are views through the corpus callosum (“c”) where β-gal+ NSCs (red cells, arrows) are seen migrating from their site of implantation on one side of the brain toward tumor on the other. Two representative NSCs indicated by arrows in C are viewed at higher magnification in D and E, respectively, to visualize the classic elongated morphology and leading process of a migrating neural progenitor oriented toward its target. In F, β-gal+ NSCs (red) are “homing in” on the GFP+ tumor (green) having migrated from the other hemisphere. In G, and magnified further in H, the X-Gal+ blue NSCs (arrows) have now actually entered the neutral red+ tumor (arrowheads) from the opposite hemisphere. (I and J) Intraventricular (Paradigm 4). Shown here is a section through the brain tumor of an adult nude mouse 6 days following NSC injection into the contralateral cerebral ventricle. In I, as per the schematic, blue X-Gal+ NSCs are distributed within the neutral red+ main tumor bed (edge delineated by arrowheads). At higher power in J, the NSCs are in juxtaposition to migrating islands of red glioblastoma cells. Fibroblast control cells never migrated from their injection site in any paradigm. All X-Gal-positivity was corroborated by anti-β-gal immunoreactivity. (Scale bar: A, 20 μm, and applies to C; B, 8 μm, 14 μm in D and E, 30 μm in F and G, 15 μm in H, 20 μm in I, and 15 μm in J.)
Figure 4
Figure 4
NSCs injected into tail vein “target” intracerebral gliomas. Paradigm 5 is illustrated. (A–C) Progressively higher power views of representative 10-μm sections through the brain 4 days after NSC injection, processed with X-Gal histochemistry (A) and anti-β-gal immunocytochemistry (B and C) to identify donor NSCs and counterstained with neutral red to delineate the tumor border. (The β-gal immunoproduct, in addition to providing independent identity confirmation, typically fills cells and processes much better than X-Gal.) At low power (A), X-Gal+ NSCs (representative X-Gal precipitate enlarged in Inset) are distributed throughout the tumor but not in surrounding normal tissue. Sister sections, reacted with an anti-β-gal antibody and visualized at higher power in B and further magnified in C confirm the presence of donor-derived cells (arrow) within the tumor. (Scale bar: A, 25 μm, 20 μm in B, and 12 μm in C.)
Figure 5
Figure 5
Human NSCs (hNSCs) possess tumor tracking characteristics. (A and B) Rodent CNS-1 glioblastoma cells and human NSCs were implanted as per Paradigm 3 into opposite hemispheres of an adult mouse. Pictured 7 days later at low power (A) and high power (B) is a section through the neutral red-stained tumor (outlined by arrowheads) intermixed with human NSCs (identified by their brown nuclei following reaction with an anti-human nuclear antibody) (arrows) that migrated from the contralateral side. (CE) Human HGL21 glioblastoma cells and hNSCs were similarly implanted into opposite hemispheres. Pictured at progressively higher power are sections through that neutral red-stained tumor intermixed with human NSCs (X-Gal+ blue) that migrated from the contralateral side. (Scale bars: A, 20 μm, 15 μm in B; C, 60 μm, 30 μm in D, and 15 μm in E.)
Figure 6
Figure 6
Bioactive transgene (CD) remains functional (as assayed by in vitro oncolysis) when expressed within NSCs. CNS-1 glioblastoma cells (red) were cocultured with CD-transduced murine NSCs (A and B) (blue). Cocultures unexposed to 5-FC grew healthily and confluent (A), whereas plates exposed to 5-FC showed dramatic loss of tumor cells (B), represented quantitatively by the histograms (*, P < 0.001). The oncolytic effect was identical whether 1 × 10⁵ CD-NSCs or half that number were cocultured with a constant number of tumor cells. (In this paradigm, subconfluent NSCs were still mitotic at the time of 5-FC exposure and thus also subject to self-elimination by the generated 5-fluorouracil and its toxic metabolites.)
Figure 7
Figure 7
Expression of a bioactive transgene (CD) delivered by NSCs is retained in vivo as assayed by reduction in tumor mass. The size of an intracranial glioblastoma populated with CD-NSCs in an adult nude mouse treated with 5-FC was compared with that of tumor treated with 5-FC but lacking CD-NSCs. These data, standardized against and expressed as a percentage of a control tumor populated with CD-NSCs receiving no treatment, are presented in the histograms in A. These measurements were derived from measuring the surface area of tumors (like those in Figs. 2–5), representative camera lucidas of which are presented in B–D. Note the large areas of a control non-5-FC-treated tumor containing CD-NSCs (B) and a control 5-FC-treated tumor lacking CD-NSCs (C) as compared with the dramatically smaller tumor areas of the 5-FC-treated animal who also received CD-NSCs (D) (≈80% reduction as per the histogram in A; *, P < 0.001), suggesting both activity and specificity of the transgene. The lack of effect of 5-FC on tumor mass when no CD-bearing NSCs were within the tumor (C) was identical to the effect of CD-NSCs in the tumor without the gene being used (B).

Comment in

Similar articles

Cited by

References

    1. Black P M, Loeffler J, editors. Cancer of the Nervous System. Oxford: Blackwell; 1997.
    1. Kramm C M, Sena-Esteves M, Barnett F H, Rainov N G, Schuback D E, Yu J S, Pechan P A, Paulus W, Chiocca E A, Breakefield X O. Brain Pathol. 1995;5:345–381. - PubMed
    1. Gage F H. Science. 2000;287:1433–1438. - PubMed
    1. McKay R. Science. 1997;276:66–71. - PubMed
    1. Flax J D, Aurora S, Yang C, Simonin C, Wills A M, Billinghurst M J, Sidman R L, Wolfe J H, Kim S U, Snyder E Y. Nat Biotech. 1998;16:1033–1039. - PubMed

Publication types

MeSH terms