. 2000 Nov 15;28(22):4452-9.
doi: 10.1093/nar/28.22.4452.

The microarray explorer tool for data mining of cDNA microarrays: application for the mammary gland

Affiliations

The microarray explorer tool for data mining of cDNA microarrays: application for the mammary gland

P F Lemkin et al. Nucleic Acids Res. .

Abstract

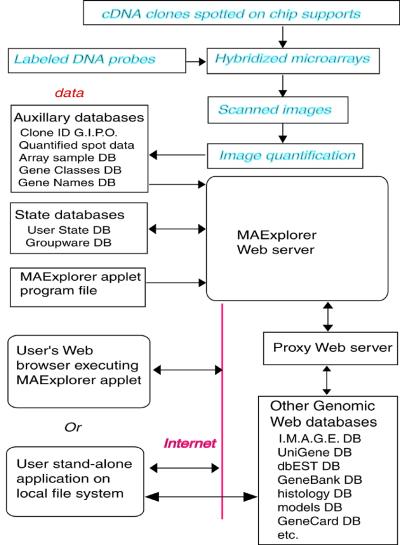
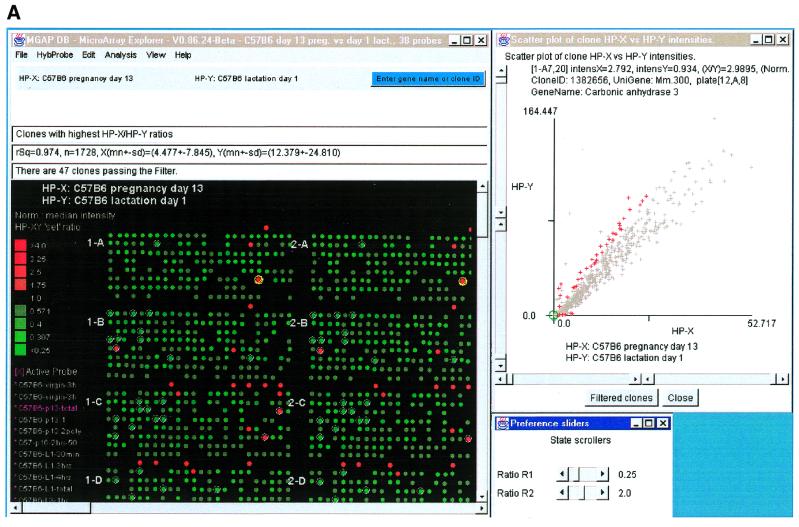
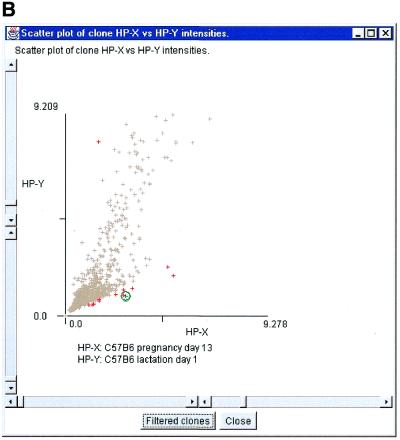
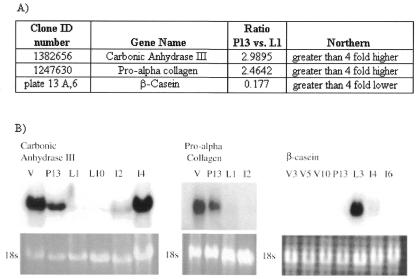
The Microarray Explorer (MAExplorer) is a versatile Java-based data mining bioinformatic tool for analyzing quantitative cDNA expression profiles across multiple microarray platforms and DNA labeling systems. It may be run as either a stand-alone application or as a Web browser applet over the Internet. With this program it is possible to (i) analyze the expression of individual genes, (ii) analyze the expression of gene families and clusters, (iii) compare expression patterns and (iv) directly access other genomic databases for clones of interest. Data may be downloaded as required from a Web server or in the case of the stand-alone version, reside on the user's computer. Analyses are performed in real-time and may be viewed and directly manipulated in images, reports, scatter plots, histograms, expression profile plots and cluster analyses plots. A key feature is the clone data filter for constraining a working set of clones to those passing a variety of user-specified logical and statistical tests. Reports may be generated with hypertext Web access to UniGene, GenBank and other Internet databases for sets of clones found to be of interest. Users may save their explorations on the Web server or local computer and later recall or share them with other scientists in this groupware Web environment. The emphasis on direct manipulation of clones and sets of clones in graphics and tables provides a high level of interaction with the data, making it easier for investigators to test ideas when looking for patterns. We have used the MAExplorer to profile gene expression patterns of 1500 duplicated genes isolated from mouse mammary tissue. We have identified genes that are preferentially expressed during pregnancy and during lactation. One gene we identified, carbonic anhydrase III, is highly expressed in mammary tissue from virgin and pregnant mice and in gene knock-out mice with underdeveloped mammary epithelium. Other genes, which include those encoding milk proteins, are preferentially expressed during lactation.


Figures

Figure 1
Figure 1
Overview of MAExplorer exploratory data analysis system. Initial data preparation steps are performed prior to analysis by MAExplorer and are indicated by cyan italics at the top of the figure (see Materials and Methods).
Figure 2
Figure 2
Screen view of part of a MAExplorer data mining session. (A) Screen showing the main MAExplorer window, scatter-plot and ratio-range threshold sliders for selecting clones of interest. The data for each probe was normalized by the median of spot intensity (for each hybridized probe) as described in the reference manual. The numeric values and plot scales reflect this normalization method. The MAExplorer user interface is similar to a Windows PC application with a set of pull-down menus which invoke operations. These menus are fully documented in the on-line reference manual. The currently selected hybridization probe array is displayed as a microarray pseudo image. In the examples used in this paper, we started MAExplorer on a database ‘C57BL/6 pregnancy day 13 versus lactation day 1’. The ordered list of 38 probes includes three C57BL/6 pregnancy day 13 (HP-X ‘set’), five C57BL/6 lactation day 1 samples (HP-Y ‘set’), as well as other stages of mammary development from normal and knock-out mice. The current gene class of clones had been set to the lactation genes of one of the authors (31). This example shows data filtered genes with white circle’s in the array image. Clicking on a spot assigns it as the current clone with data being reported in the top most message area. The names of the averaged HP-X and HP-Y samples are listed above that area and in the scatter plot. CA-III was selected as the current clone. In this database, all clones are in the left (field F1 of the array image) and are duplicated in the right (field F2). Therefore selected clones are indicated twice. In general, clicking on a spot in the array image, a point in scatter or clustergram plots, or a cell in a spreadsheet report assigns it as the clone, labels it, and accesses Web genomic databases. CA-III is indicated by a yellow (green) circle in the array image (scatter plot). Red (gray) ‘+’ indicates clones passing (failing) the data filter. (B) Zoomed region of scatter plot showing CA-III set as the current clone (green circle).
Figure 2
Figure 2
Screen view of part of a MAExplorer data mining session. (A) Screen showing the main MAExplorer window, scatter-plot and ratio-range threshold sliders for selecting clones of interest. The data for each probe was normalized by the median of spot intensity (for each hybridized probe) as described in the reference manual. The numeric values and plot scales reflect this normalization method. The MAExplorer user interface is similar to a Windows PC application with a set of pull-down menus which invoke operations. These menus are fully documented in the on-line reference manual. The currently selected hybridization probe array is displayed as a microarray pseudo image. In the examples used in this paper, we started MAExplorer on a database ‘C57BL/6 pregnancy day 13 versus lactation day 1’. The ordered list of 38 probes includes three C57BL/6 pregnancy day 13 (HP-X ‘set’), five C57BL/6 lactation day 1 samples (HP-Y ‘set’), as well as other stages of mammary development from normal and knock-out mice. The current gene class of clones had been set to the lactation genes of one of the authors (31). This example shows data filtered genes with white circle’s in the array image. Clicking on a spot assigns it as the current clone with data being reported in the top most message area. The names of the averaged HP-X and HP-Y samples are listed above that area and in the scatter plot. CA-III was selected as the current clone. In this database, all clones are in the left (field F1 of the array image) and are duplicated in the right (field F2). Therefore selected clones are indicated twice. In general, clicking on a spot in the array image, a point in scatter or clustergram plots, or a cell in a spreadsheet report assigns it as the clone, labels it, and accesses Web genomic databases. CA-III is indicated by a yellow (green) circle in the array image (scatter plot). Red (gray) ‘+’ indicates clones passing (failing) the data filter. (B) Zoomed region of scatter plot showing CA-III set as the current clone (green circle).
Figure 3
Figure 3
Expression of mRNAs encoding CA-III, pro α-collagen and β-casein in mouse mammary tissue by microarray and northern blot analyses. (A) Table of averaged clone ratios calculated in MAExplorer for each clone (comparing C57BL/6 pregnancy day 13 mammary glands to C57BL/6 lactation day 1 mammary glands). (B) Northern blot confirmation of microarray data for each clone. Total RNA for the following stages was used in the northern: V, virgin; P13, pregnancy day 13; L1, lactation day 1; L10, lactation day 10; I2, involution day 2; I4, involution day 4; I6, involution day 6. 18S ribosomal bands are shown as loading controls.

References

    1. Tukey J. (1977) Exploratory Data Analysis. Addison-Wesley Pub. Co., Reading, MA, pp. 1–688.
    1. Tufte E. (1997) Visual Explanations. Images and Quantities, Evidence and Narrative. Graphics Press, Cheshire, CT, pp. 1–156.
    1. Cleveland W.S. (1985) The Elements of Graphing Data. Wadsworth Press, Monterey, CA, pp. 1–323.
    1. Ermolaeva O., Rastogi,M., Pruitt,K.D., Schuler,G.D., Bittner,M.L., Chen,Y., Simon,R., Meltzer,P., Trent,J.M. and Boguski,M.S. (1998) Nature Genet., 20, 19–23. - PubMed
    1. Lipkin L.E. and Lemkin,P.F. (1980) Clin. Chem., 26, 1403–1412. - PubMed