Comparative Study
. 2000 Nov 15;28(22):4514-22.
doi: 10.1093/nar/28.22.4514.

NMR structure of a DNA duplex containing nucleoside analog 1-(2'-deoxy-beta-D-ribofuranosyl)-3-nitropyrrole and the structure of the unmodified control

Affiliations
Comparative Study

NMR structure of a DNA duplex containing nucleoside analog 1-(2'-deoxy-beta-D-ribofuranosyl)-3-nitropyrrole and the structure of the unmodified control

D A Klewer et al. Nucleic Acids Res. .

Abstract

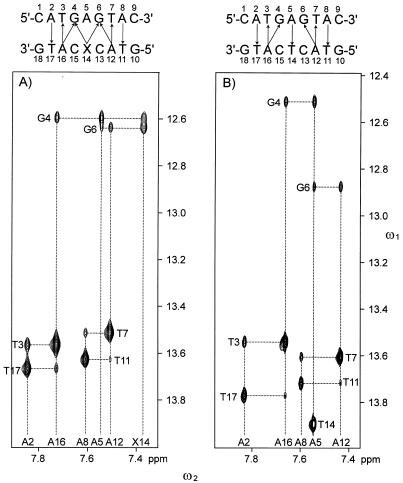
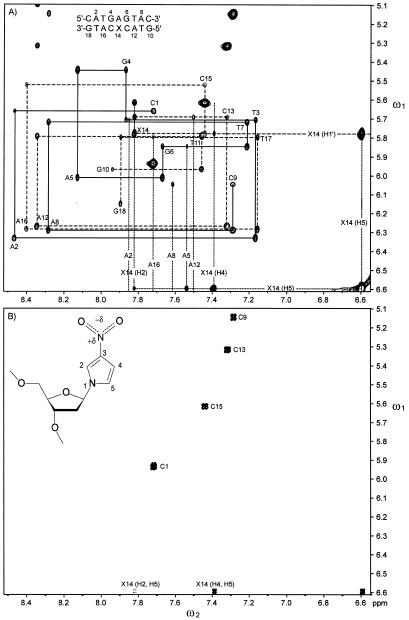
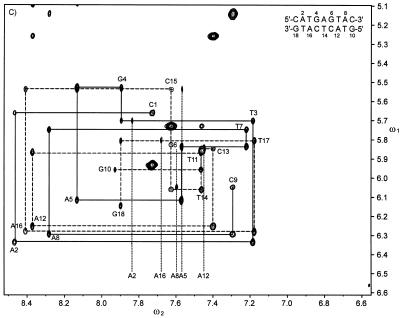
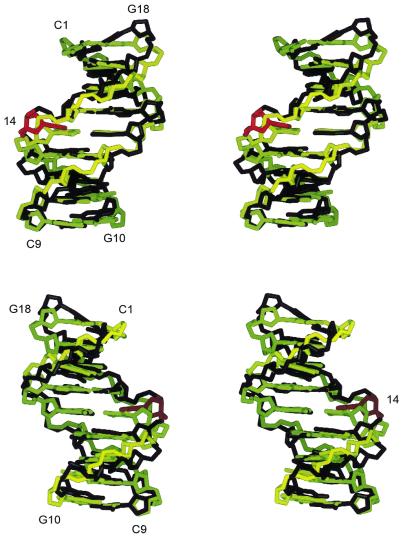
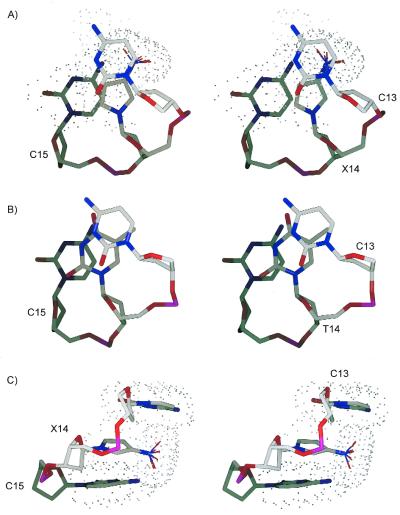
The three-dimensional structures of two DNA duplexes d(CATGAGTAC). d(GTACXCATG) (1) and d(CATGAGTAC).d(GTACTCATG) (2), where X represents 1-(2'-deoxy-beta-D-ribofuranosyl)-3-nitropyrrole, were solved using high resolution nuclear magnetic resonance spectroscopy and restrained molecular dynamics. Good convergence was observed between final structures derived from A- and B-form starting geometries for both 1 and 2. Structures of 1 and 2 are right-handed duplexes within the B-form conformational regime. Furthermore, the structures of 1 and 2 are highly similar, with differences in the structures localized to the vicinity of residue 14 (X versus T). The pyrrole group of 1 is in the syn conformation and it is displaced towards the major groove. Furthermore, unlike T14 in 2, the base of X14 has reduced pi-pi stacking interactions with C13 and C15 and the nitro group of X14 is pointing out of the major groove. The structures presented here establish the basis of the thermal data of DNA duplexes containing X and should be informative during the design of improved wild card nucleobase analogs.


Figures

Figure 1
Figure 1
An expansion of H2O NOESY spectra of (A) 1 and (B) 2 in the aromatic to imino proton region. Dashed vertical lines, the positions of the resonances of the H2 and H4 protons of the adenine and 3-nitropyrrole residues; dashed horizontal lines, the positions of the resonances of the imino protons of the cytosine and guanine residues; solid arrows, interstrand cross peaks observed in the spectra.
Figure 2
Figure 2
Expansions of (A) D2O NOESY and (B) 2QF-COSY spectra of 1 and of a (C) D2O NOESY spectrum of 2. In the NOESY spectra: solid lines, uninterrupted connectivities of residues 1–9; dashed lines, uninterrupted connectivities of residues 10–18. Dotted lines, adenine H2 and 3-nitropyrrole H2, H4 and H5 chemical shifts. Inset, 1-(2′-deoxy-β-d-ribofuranosyl)-3-nitropyrrole in the syn conformation.
Figure 2
Figure 2
Expansions of (A) D2O NOESY and (B) 2QF-COSY spectra of 1 and of a (C) D2O NOESY spectrum of 2. In the NOESY spectra: solid lines, uninterrupted connectivities of residues 1–9; dashed lines, uninterrupted connectivities of residues 10–18. Dotted lines, adenine H2 and 3-nitropyrrole H2, H4 and H5 chemical shifts. Inset, 1-(2′-deoxy-β-d-ribofuranosyl)-3-nitropyrrole in the syn conformation.
Figure 3
Figure 3
Correlation plots of D2O NOESY cross peak intensities determined experimentally (Iexp) and from a two-dimensional fit (Ifit) of the (resolved) experimental cross peaks for both (A) 1 and (B) 2. Corresponding cross peaks across the diagonal were not averaged in these plots and the data points correspond to individual cross peaks. Plots such as these are useful for finding poorly fit cross peaks for subsequent refitting. For example, the circled peaks are due to underestimated volumes of methyl (ω2), H1′ (ω1) cross peaks.
Figure 4
Figure 4
Stereoviews of the final structures of 1 and 2. The final structure of 1 is shown in black except for residue X14, which is shown in red. The final structure of 2 is shown in yellow. Each structure is the energy-minimized average of 10 A- and 10 B-form derived structures. See text for details. The figures were generated by the molecular modeling program SPOCK (56). As there is no experimental data indicating the positions of the oxygen atoms of the nitro group of X14, they are not shown.
Figure 5
Figure 5
Stereoview of residues C13, X14 and C15 of 1 from the (A) top (i.e. 5′→3′) and (C) side. (B) Residues C13, T14 and C15 of 2 from the top. The dots outline the van der Waals surfaces of the bases. The N–O bonds of the nitro group of X14 are drawn as thinner cylinders and they are shown in several orientations. Gray, blue, red and magenta colors are used to shade the carbon, nitrogen, oxygen and phosphorus atoms, respectively.
Figure 6
Figure 6
Backbone and glycosidic dihedral angles of residues (A, opposite) 1–9 and (B, above) 10–18 for 1 and 2. Shown for 1 and 2 are the final 10 A- and 10 B-form derived structures. Values for 1 are plotted in blue, those for 2 are shown in red. The vertical green line represents a value of zero. Values for standard A- and B-DNA are, respectively, α (–sc, –sc), β (+ap, –ac), γ (+sc, +sc), δ (+sc, +ap), ɛ (–ac, +ap), ζ (–sc, –ac) and χ (–ap, –ac) (52,57,58). This figure was generated using the program MOLMOL (59).
Figure 6
Figure 6
Backbone and glycosidic dihedral angles of residues (A, opposite) 1–9 and (B, above) 10–18 for 1 and 2. Shown for 1 and 2 are the final 10 A- and 10 B-form derived structures. Values for 1 are plotted in blue, those for 2 are shown in red. The vertical green line represents a value of zero. Values for standard A- and B-DNA are, respectively, α (–sc, –sc), β (+ap, –ac), γ (+sc, +sc), δ (+sc, +ap), ɛ (–ac, +ap), ζ (–sc, –ac) and χ (–ap, –ac) (52,57,58). This figure was generated using the program MOLMOL (59).

References

    1. Day J.P., Bergstrom,D., Hammer,R.P. and Barany,F. (1999) Nucleic Acids Res., 27, 1810–1818. - PMC - PubMed
    1. van Aerschot A., Rozenski,J., Loakes,D., Pillet,N., Schepers,G. and Herdewijn,P. (1995) Nucleic Acids Res., 23, 4363–4370. - PMC - PubMed
    1. Ahmadian M., Zhang,P.M. and Bergstrom,D.E. (1998) Nucleic Acids Res., 26, 3127–3135. - PMC - PubMed
    1. Bergstrom D.E., Zhang,P.M. and Johnson,W.T. (1997) Nucleic Acids Res., 25, 1935–1942. - PMC - PubMed
    1. Brown D.M. and Lin,P.K.T. (1991) Carbohydr. Res., 216, 129–139. - PubMed

Publication types

MeSH terms