Comparative Study
. 2000 Nov;10(11):1672-8.
doi: 10.1101/gr.148900.

Is "junk" DNA mostly intron DNA?

Affiliations
Comparative Study

Is "junk" DNA mostly intron DNA?

G K Wong et al. Genome Res. 2000 Nov.

Abstract

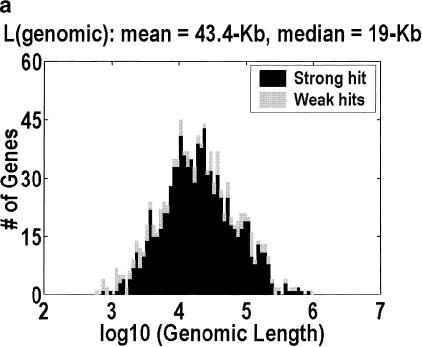
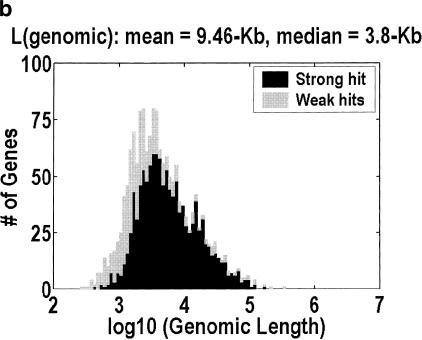
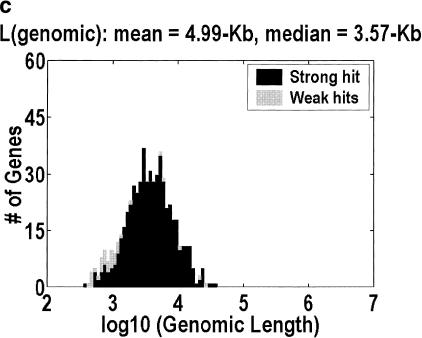
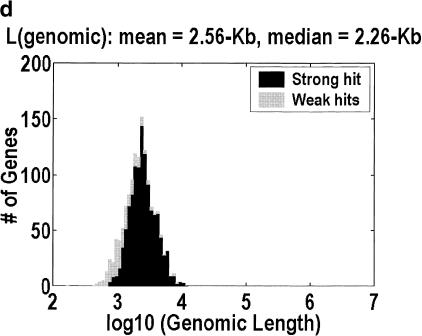
Among higher eukaryotes, very little of the genome codes for protein. What is in the rest of the genome, or the "junk" DNA, that, in Homo sapiens, is estimated to be almost 97% of the genome? Is it possible that much of this "junk" is intron DNA? This is not a question that can be answered just by looking at the published data, even from the finished genomes. One cannot assume that there are no genes in a sequenced region, just because no genes were annotated. We introduce another approach to this problem, based on an analysis of the cDNA-to-genomic alignments, in all of the complete or nearly-complete genomes from the multicellular organisms. Our conclusion is that, in animals but not in plants, most of the "junk" is intron DNA.


Figures

Figure 1
Figure 1
Distribution of genomic lengths for (a) Homo sapiens, (b) Drosophila melanogaster, (c) Caenorhabditis elegans, and (d) Arabidopsis thaliana. Dark shading indicates strong hits. Weak hits (lightly shaded) represent cDNA-to-genomic alignments with <3 exons or <50% of the cDNA length aligned. An overwhelming majority of these weak hits are actually complete alignments with only one or two exons. Instances in which <50% of the cDNA is aligned represent 7.3%, 3.3%, 1.2%, and 0.9% of the genes in the four organisms, respectively.
Figure 1
Figure 1
Distribution of genomic lengths for (a) Homo sapiens, (b) Drosophila melanogaster, (c) Caenorhabditis elegans, and (d) Arabidopsis thaliana. Dark shading indicates strong hits. Weak hits (lightly shaded) represent cDNA-to-genomic alignments with <3 exons or <50% of the cDNA length aligned. An overwhelming majority of these weak hits are actually complete alignments with only one or two exons. Instances in which <50% of the cDNA is aligned represent 7.3%, 3.3%, 1.2%, and 0.9% of the genes in the four organisms, respectively.
Figure 2
Figure 2
Is the collection of Homo sapiens cDNA sequence biased? We aligned the 1,856,102 ESTs in GenBank to our cDNA sequences and plotted the number of aligned ESTs as a function of the genomic length. Multiple reads from the same clone are counted only once. There is no obvious bias, indicating that cDNAs for genes of every genomic length are equally easy to isolate.
Figure 3
Figure 3
Is the collection of Homo sapiens genomic sequence biased? We computed the probability that cDNAs of a particular GC content aligned to genomic seqence, given that only 369 Mb of nonredundant finished genomic sequence were available. The solid line (on an arbitrary scale) indicates the initial collection of cDNAs. The obvious bias toward GC-rich cDNAs is important because these are known to correspond to smaller genes (Bernardi 2000). Dark shading shows strong hits; light shading shows weak hits.
Figure 4
Figure 4
Distribution of GC content for anonymous genomic sequence in Arabidopsis thaliana. The idea that a significant fraction of the genome is intergenic, coupled with the fact that intergenic DNA has a lower GC content than intragenic DNA, suggests that this distribution will be bimodal. However, the bimodality is easily obscured by how the data are plotted. a and b differ in the size of the bins over which the GC content is computed, 1 kb and 5 kb, respectively. Bin sizes larger than the average gene size of 2.6 kb obscure the effect because every bin is likely to contain a mixture of intragenic and intergenic DNA. a and c differ in the genomic contigs that are plotted (every contig or only contigs <35 kb, respectively). By removing the large-insert clones favored by the genome centers, what is left behind are those sequences that were analyzed only because they contain a likely gene. Hence, the bimodality disappears.
Figure 4
Figure 4
Distribution of GC content for anonymous genomic sequence in Arabidopsis thaliana. The idea that a significant fraction of the genome is intergenic, coupled with the fact that intergenic DNA has a lower GC content than intragenic DNA, suggests that this distribution will be bimodal. However, the bimodality is easily obscured by how the data are plotted. a and b differ in the size of the bins over which the GC content is computed, 1 kb and 5 kb, respectively. Bin sizes larger than the average gene size of 2.6 kb obscure the effect because every bin is likely to contain a mixture of intragenic and intergenic DNA. a and c differ in the genomic contigs that are plotted (every contig or only contigs <35 kb, respectively). By removing the large-insert clones favored by the genome centers, what is left behind are those sequences that were analyzed only because they contain a likely gene. Hence, the bimodality disappears.

Similar articles

Cited by

References

    1. Adams MD, Celniker SE, Holt RA, Evans CA, Gocayne JD, et al. The genome sequence of Drosophila melanogaster. Science. 2000;287:2185–2195. - PubMed
    1. Antequera F, Bird AP. Number of CpG islands and genes in human and mouse. Proc Natl Acad Sci. 1993;90:11995–11999. - PMC - PubMed
    1. Bennetzen JL, SanMiguel P, Chen M, Tikhonov A, Francki M, et al. Grass genomes. Proc Natl Acad Sci. 1998;95:1975–1978. - PMC - PubMed
    1. Bernardi G. Isochores and the evolutionary genomics of vertebrates. Gene. 2000;241:3–17. - PubMed
    1. Burset M, Guigo R. Evaluation of gene structure prediction programs. Genomics. 1996;34:353–367. - PubMed

Publication types

LinkOut - more resources