Comparative Study
. 2000 Nov;10(11):1711-8.
doi: 10.1101/gr.161600.

Novel imprinted DLK1/GTL2 domain on human chromosome 14 contains motifs that mimic those implicated in IGF2/H19 regulation

Affiliations
Comparative Study

Novel imprinted DLK1/GTL2 domain on human chromosome 14 contains motifs that mimic those implicated in IGF2/H19 regulation

A A Wylie et al. Genome Res. 2000 Nov.

Abstract

The evolution of genomic imprinting in mammals occurred more than 100 million years ago, and resulted in the formation of genes that are functionally haploid because of parent-of-origin-dependent expression. Despite ample evidence from studies in a number of species suggesting the presence of imprinted genes on human chromosome 14, their identity has remained elusive. Here we report the identification of two reciprocally imprinted genes, GTL2 and DLK1, which together define a novel imprinting cluster on human chromosome 14q32. The maternally expressed GTL2 (gene trap locus 2) gene encodes for a nontranslated RNA. DLK1 (delta, Drosophila, homolog-like 1) is a paternally expressed gene that encodes for a transmembrane protein containing six epidermal growth factor (EGF) repeat motifs closely related to those present in the delta/notch/serrate family of signaling molecules. The paternal expression, chromosomal localization, and biological function of DLK1 also make it a likely candidate gene for the callipyge phenotype in sheep. Many of the predicted structural and regulatory features of the DLK1/GTL2 domain are highly analogous to those implicated in IGF2/H19 imprint regulation, including two hemimethylated consensus binding sites for the vertebrate enhancer blocking protein, CTCF. These results provide evidence that a common mechanism and domain organization may be used for juxtapositioned, reciprocally imprinted genes.


Figures

Figure 1
Figure 1
Predicted genomic structure and expression patterns for GTL2. (A) Predicted genomic structure of GTL2. Black boxes and horizontal lines denote exons and introns, respectively. (*) shows the location of a single nucleotide polymorphism in exon 5 (position 86,647 of accession no. AL117190). (B) Parent-of-origin–dependent monoallelic expression of GTL2. An 85-d gestation conceptus heterozygous for the A/G polymorphism in exon 5 of GTL2 was used to determine the allelic expression of GTL2. The maternal genotype is G/G, demonstrating paternal inheritance of the A allele in the conceptus. Analysis of RNA isolated from the indicated tissues shows exclusive expression of the maternally derived G allele (i.e., A allele is unexpressed; arrowhead).
Figure 2
Figure 2
Predicted genomic structure and expression analysis of DLK1. (A) Predicted genomic structure of DLK1. Black boxes and horizontal lines denote exons and introns, respectively. (*) shows the location of a single nucleotide polymorphism in exon 5 (position 148,740 of accession no. AL132711). (B) Parent-of-origin–dependent monoallelic expression of DLK1. The allelic expression of DLK1 was determined using a 108-d gestation conceptus heterozygous for the C/T polymorphism in exon 5. The maternal genotype is C/C, demonstrating paternal inheritance of the T allele in the conceptus. RNA analysis of the indicated tissues shows exclusive expression of the paternally derived T allele (i.e., C allele is unexpressed; arrowhead).
Figure 3
Figure 3
Methylation analysis of the DLK1/GTL2 CpG-rich regions. (A) Schematic representation of the DLK1/GTL2 genomic region. The transcription units of DLK1 and GTL2 are indicated by the boxes with arrows above and below showing the direction of transcription for the maternally and paternally expressed genes, respectively. The hatched ovals represent CpG-rich regions. D1, D2, and D3 (positions 140,543–140,687, 141,101–141,205, and 141,459–141,594 of accession no. AL132711, respectively) and G1, G2, and G3 (positions 65,973–66,085, 66,667–66,793, and 67,780–67,926 of accession no. AL117190, respectively) correspond to sequences within the CpG-rich regions upstream of DLK1 and GTL2, respectively, that were analyzed by bisulphite sequencing. (B) Summary of methylation data. The data shown represent the methylation status of CpG dinucleotides from fetal brain, kidney, liver, and pancreas, which were indistinguishable from one another. All CpG dinucleotides present in these regions are shown. The open and half-filled circles represent unmethylated and hemimethylated CpGs, respectively.
Figure 4
Figure 4
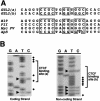
Identification and methylation analysis of putative CTCF binding sites. (A) Alignment of the putative GTL2 CTCF binding sites with known CTCF binding sites. GTL2(a)/GTL2(b), human GTL2 promoter; H19, human H19 upstream region; FII, chicken βglobin insulator; Myc FV, chicken c-myc promoter; Apβ, human amyloid β protein promoter. The GTL2(b) consensus sequence is present on the noncoding strand, and is therefore inverted for the purposes of sequence alignment. (B) Methylation analysis of the putative GTL2 CTCF binding sites. Genomic DNA isolated from fetal liver was bisulphite treated and amplified across putative CTCF binding sites (a) and (b). Diamonds denote the positions of unmethylated cytosines not present in CpG dinucleotides; they have been fully converted by bisulphite treatment. The presence of bands in both the T and C lanes (arrowheads) shows hemimethylation of cytosine residues within the CpG dinucleotides contained within and adjacent to CTCF binding sites (a) and (b).
Figure 5
Figure 5
Comparison of the imprinted IGF2/H19 domain on chromosome 11p15.5 with the DLK1/GTL2 domain on chromosome 14q32. Physical distances are indicated at the top of the diagram. CTCF binding sites are indicated as shaded vertical rectangles, and black circles indicate the positions of enhancer elements. Differentially methylated regions (DMR) are indicated. G1, G2, and G3 are shown as black bars and correspond to the three areas analyzed for differential methylation (Figs. 3A,B). The position of the telomere (t) is shown relative to each imprinted domain. The transcription units for each gene are shown as boxes, and the direction of transcription for maternally and paternally expressed genes is denoted by arrows above and below the boxes.

Comment in

References

    1. Artavanis-Tsakonas S, Matsuno K, Fortini ME. Notch signaling. Science. 1995;268:225–232. - PubMed
    1. Bell AC, Felsenfeld G. Methylation of a CTCF-dependent boundary controls imprinted expression of the Igf2 gene. Nature. 2000;405:482–485. - PubMed
    1. Carlsson C, Tornehave D, Lindberg K, Galante P, Billestrup N, Michelsen B, Larsson LI, Nielsen JH. Growth hormone and prolactin stimulate the expression of rat preadipocyte factor-1/delta-like protein in pancreatic islets: Molecular cloning and expression pattern during development and growth of the endocrine pancreas. Endocrinology. 1997;138:3940–3948. - PubMed
    1. Cattanach BM, Beechey CV. Genomic imprinting in the mouse: Possible final analysis. In: Reik W, Surani A, editors. Genomic Imprinting. Oxford, UK: IRL Press; 1997. pp. 118–145.
    1. Cockett NE, Jackson SP, Shay TL, Farnir F, Berghmans S, Snowder GD, Nielsen DM, Georges M. Polar overdominance at the ovine callipyge locus. Science. 1996;273:236–238. - PubMed

Publication types

MeSH terms

LinkOut - more resources