. 2000 Nov 13;151(4):863-78.
doi: 10.1083/jcb.151.4.863.

Mechanism of metabolic control. Target of rapamycin signaling links nitrogen quality to the activity of the Rtg1 and Rtg3 transcription factors

Affiliations

Mechanism of metabolic control. Target of rapamycin signaling links nitrogen quality to the activity of the Rtg1 and Rtg3 transcription factors

A Komeili et al. J Cell Biol. .

Abstract

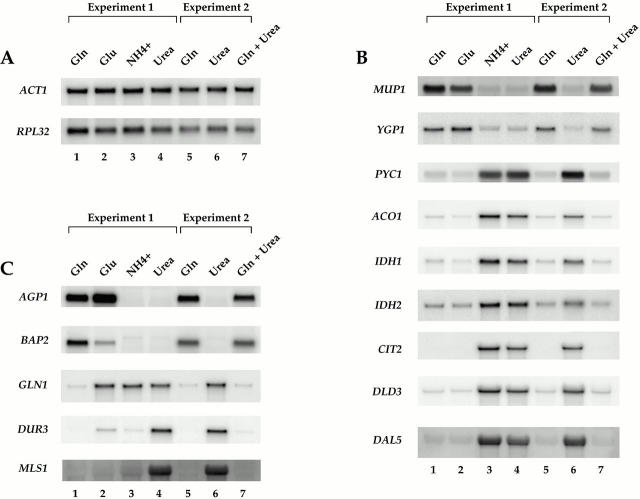
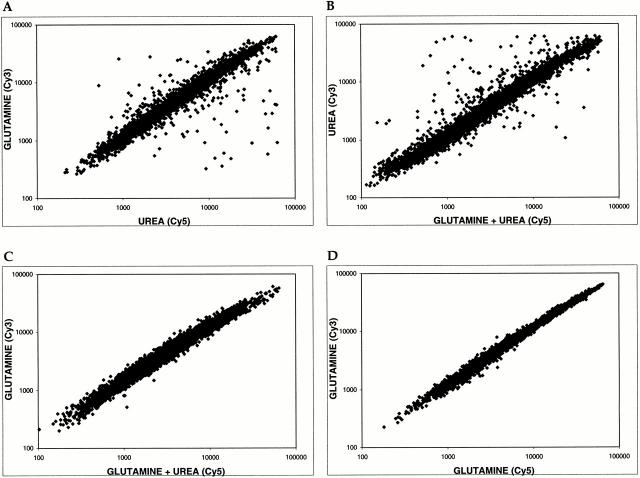
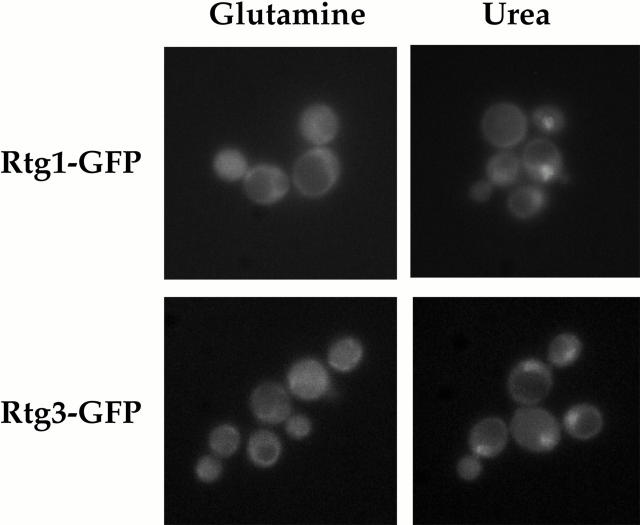
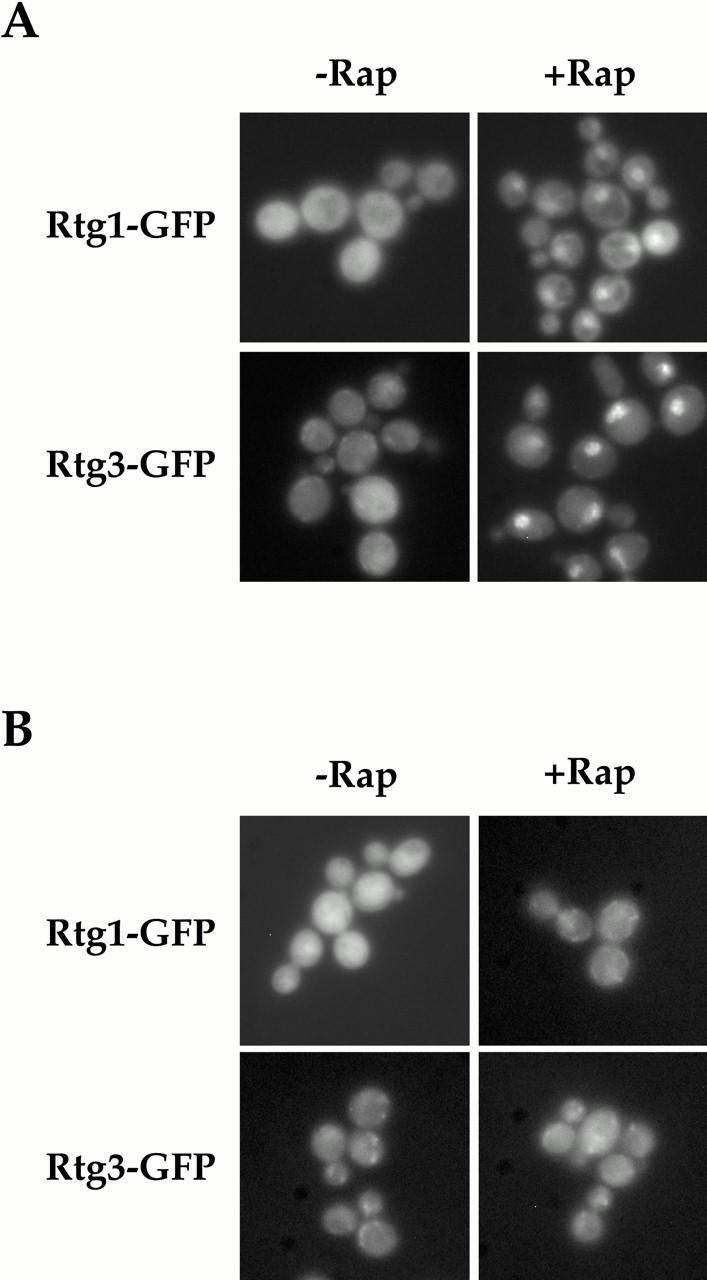
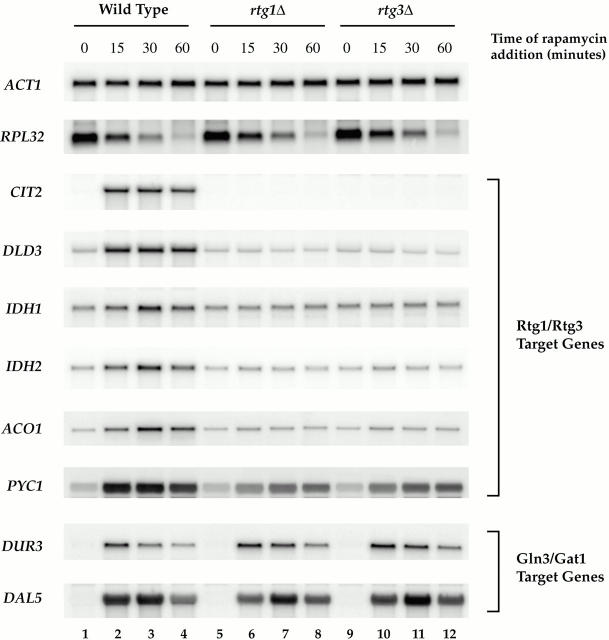
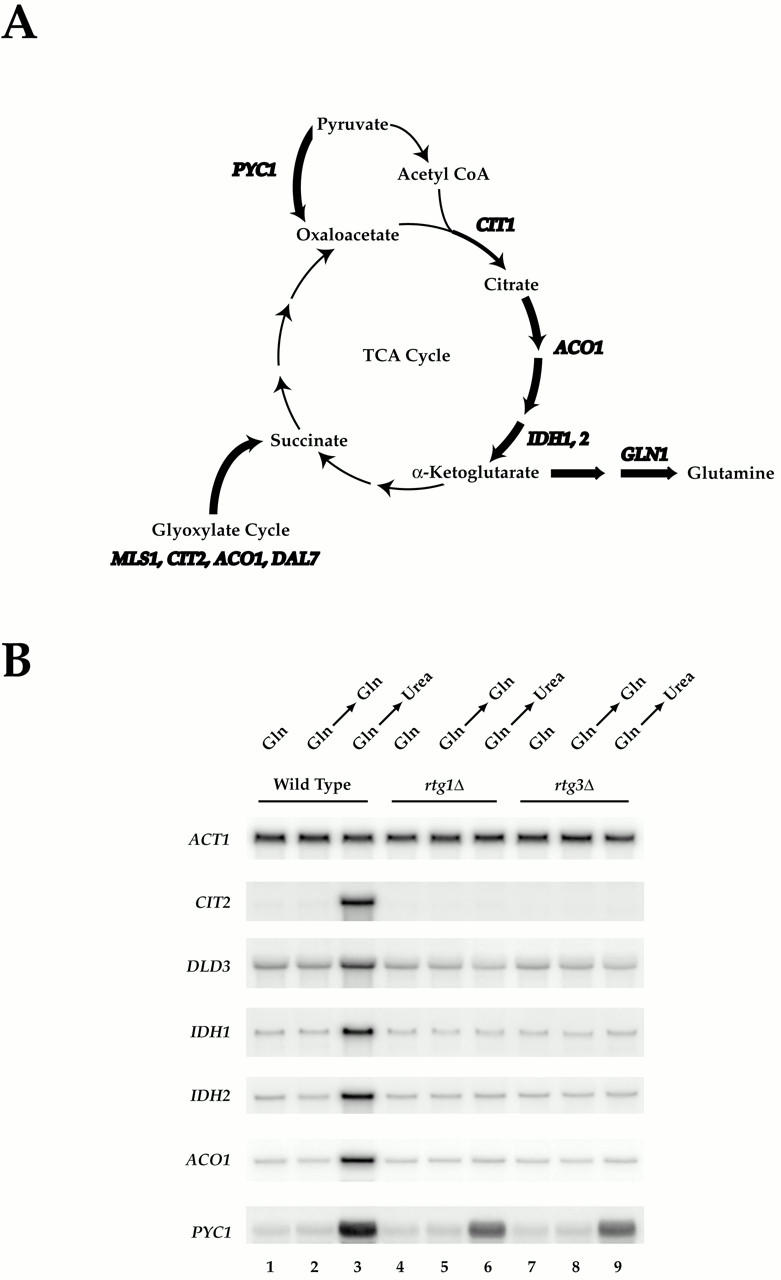
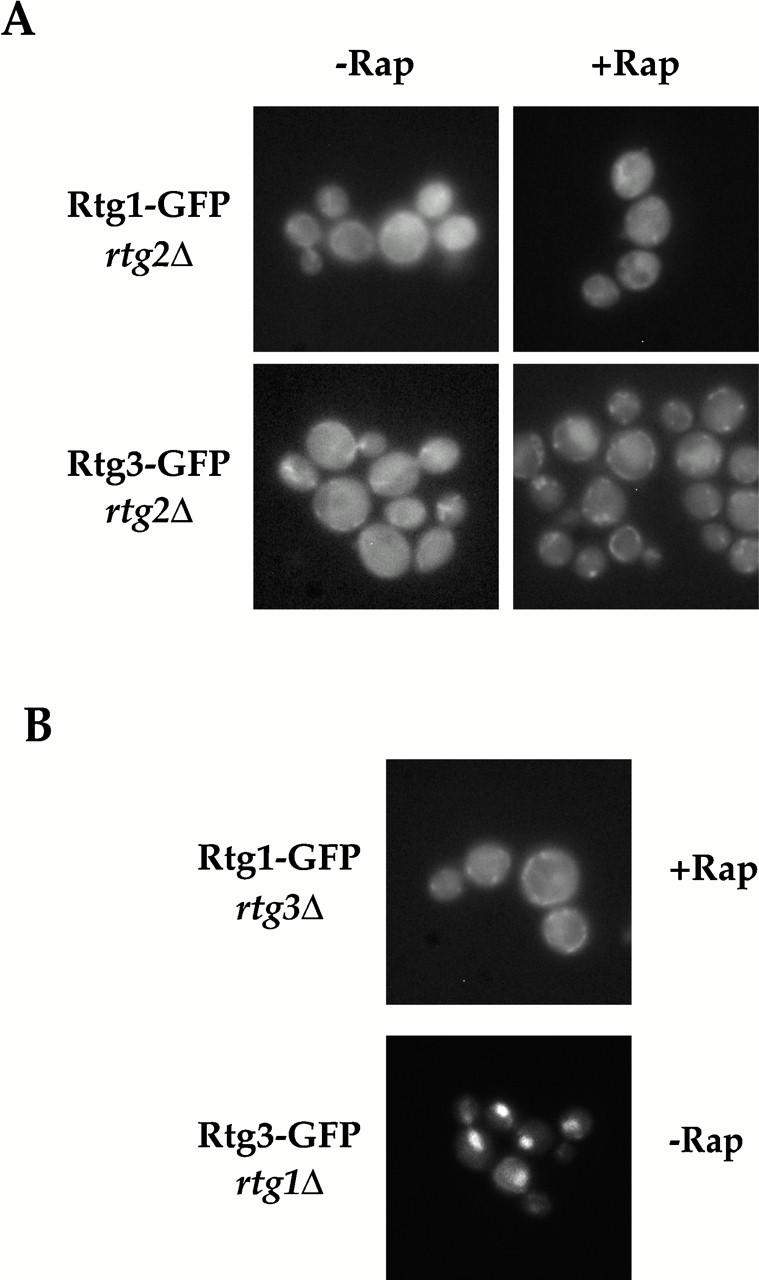
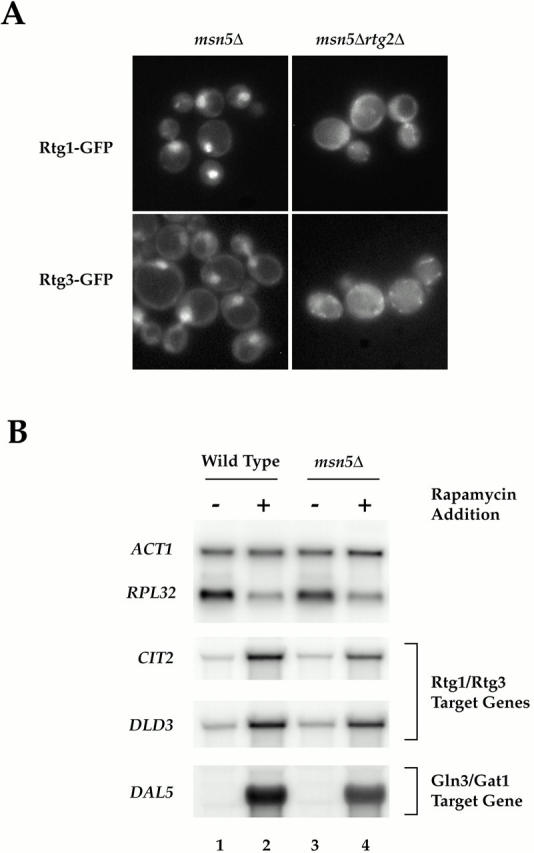
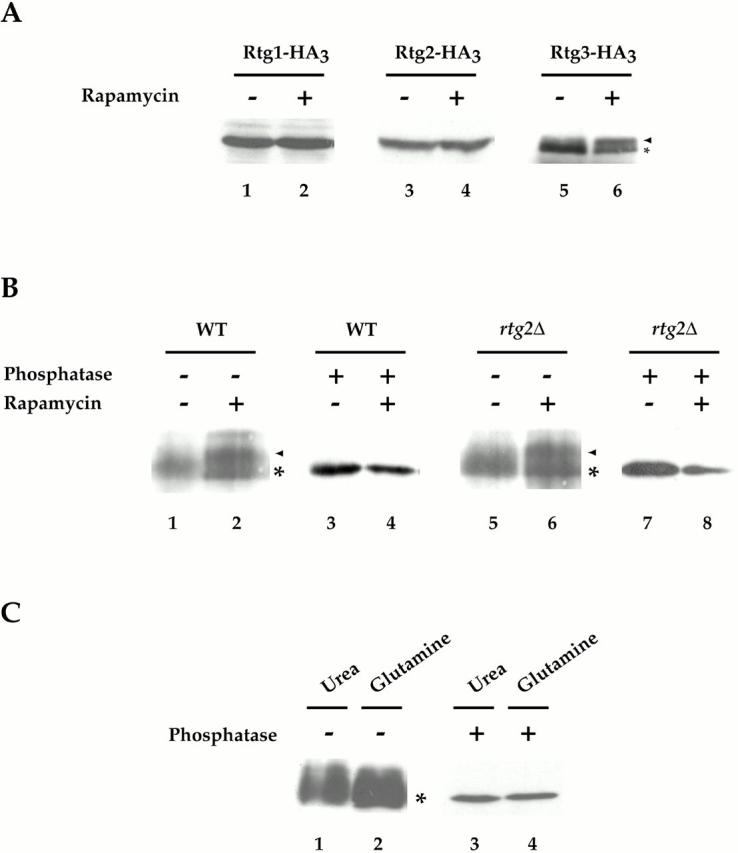
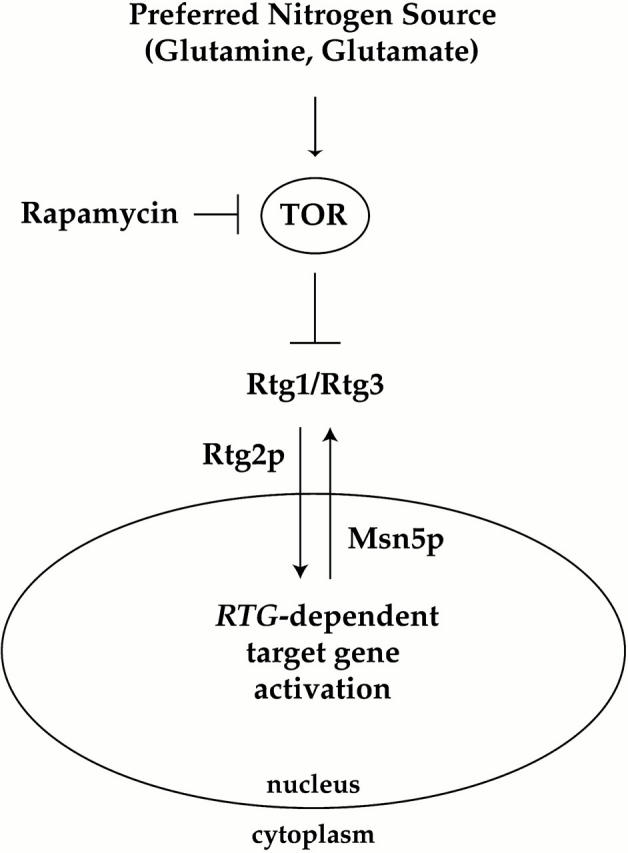
De novo biosynthesis of amino acids uses intermediates provided by the TCA cycle that must be replenished by anaplerotic reactions to maintain the respiratory competency of the cell. Genome-wide expression analyses in Saccharomyces cerevisiae reveal that many of the genes involved in these reactions are repressed in the presence of the preferred nitrogen sources glutamine or glutamate. Expression of these genes in media containing urea or ammonia as a sole nitrogen source requires the heterodimeric bZip transcription factors Rtg1 and Rtg3 and correlates with a redistribution of the Rtg1p/Rtg3 complex from a predominantly cytoplasmic to a predominantly nuclear location. Nuclear import of the complex requires the cytoplasmic protein Rtg2, a previously identified upstream regulator of Rtg1 and Rtg3, whereas export requires the importin-beta-family member Msn5. Remarkably, nuclear accumulation of Rtg1/Rtg3, as well as expression of their target genes, is induced by addition of rapamycin, a specific inhibitor of the target of rapamycin (TOR) kinases. We demonstrate further that Rtg3 is a phosphoprotein and that its phosphorylation state changes after rapamycin treatment. Taken together, these results demonstrate that target of rapamycin signaling regulates specific anaplerotic reactions by coupling nitrogen quality to the activity and subcellular localization of distinct transcription factors.


Figures

Figure 1
Figure 1
Examples of differences in gene expression during growth of yeast cells in the presence of different sources of assimilable nitrogen. Strain S288c was grown to mid-log phase in MD media containing the indicated nitrogen sources. Total mRNA was isolated and Northern blot analysis was performed, probing for the specified mRNAs. (A) Control transcripts showing no significant differences under the conditions tested. (B) Transcripts displaying similar levels of expression in MD-glutamine and MD-glutamate. (C) Transcripts displaying more complex patterns of expression.
Figure 2
Figure 2
Glutamine is both a global activator and repressor of gene expression. Scatter plots show pairwise comparisons of gene expression profiles of S288c cells grown in the presence of glutamine, urea, or glutamine + urea. (A) MD-glutamine versus MD-urea. (B) MD-urea versus MD-glutamine + urea. (C) MD-glutamine versus MD-glutamine + urea. (D) Control experiment comparing MD-glutamine with itself. For each plot, the x axis depicts cDNA samples labeled with Cy5 dye and the y axis depicts samples labeled with Cy3 dye.
Figure 4
Figure 4
Rtg1 and Rtg3 are localized within the nucleus under glutamine-limiting conditions. rtg1Δ (EY0733) or rtg3Δ (EY0735) cells were transformed with pRtg1-GFP or pRtg3-GFP, respectively, and were grown to 0.5 OD600/ml in MD-glutamine or MD-urea and examined by fluorescence microscopy. Punctate nuclear fluorescence was observed for both Rtg1-GFP and Rtg3-GFP in MD-urea. The nuclear disposition of this GFP-based fluorescence was confirmed by its colocalization with DAPI-stained nuclear DNA (data not shown).
Figure 5
Figure 5
Rtg1 and Rtg3 are localized within the nucleus after rapamycin treatment in a TOR1-dependent manner. (A) rtg1Δ (EY0733) or rtg3Δ (EY0735) cells expressing Rtg1-GFP or Rtg3-GFP, respectively, were treated with drug vehicle alone (left) or with 1 μg/ml of rapamycin (right) for 5 min, followed by examination by fluorescence microscopy. Pronounced nuclear accumulation of both Rtg1-GFP and Rtg3-GFP was observed in cells treated with rapamycin. (B) The experiment in A was repeated using cells that carried the dominant rapamycin resistant TOR1-1 allele.
Figure 6
Figure 6
Induction of RTG-dependent target genes by rapamycin. Wild-type (S288c), rtg1Δ (PLY037), and rtg3Δ (PLY039) cells were grown in MD-glutamine to 0.5 OD600/ml and were treated either with drug vehicle (lanes 1, 5, and 9) or with rapamycin for 15 (lanes 2, 6, and 10), 30 (lanes 3, 6, and 9), or 60 (lanes 4, 8, and 12) min. Cells were then harvested and RNA was prepared and analyzed by Northern blotting, probing for the specified mRNAs.
Figure 3
Figure 3
Rtg1 and Rtg3 are required for expression of distinct metabolic genes in MD-urea. (A) Summary of metabolic genes (bold) subject to glutamine-mediated transcriptional repression (see Table II; note that CIT1 is not listed in Table as its MD-glutamine/MD-urea expression ratio of ∼2.0 fell below the cut off value of 3.0 required for listing). Genes depicted were similarly repressed in MD-glutamine and MD-glutamate, except for GLN1 (see Fig. 1). (B) Nitrogen source shift experiment. Wild-type (S288c), rtg1Δ (PLY037), and rtg3Δ (PLY039) cells were grown in MD-glutamine until 0.5 OD600/ml and were either harvested (lanes 1, 4, and 7) or transferred to MD-glutamine (lanes 2, 5, and 8) or MD-urea (lanes 3, 6, and 9) media for 30 min before harvesting. RNA was prepared and analyzed by Northern blotting and probed for the specified mRNAs.
Figure 7
Figure 7
Regulated nucleocytoplasmic transport of Rtg1 and Rtg3 requires Rtg1, Rtg2, and Rtg3. (A) Rtg1-GFP and Rtg3-GFP were visualized in rtg2Δ (EY0734) cells in the absence (left) or presence (right) of rapamycin. In contrast to wild-type cells, neither Rtg1-GFP nor Rtg3-GFP relocate to the nucleus after rapamycin treatment (compare with Fig. 5 A). (B) Rtg1-GFP was visualized in rtg3Δ (EY0735) cells (top) and Rtg3-GFP was visualized in rtg1Δ (EY0733) cells (bottom). Note that Rtg1-GFP cannot accumulate in the nucleus upon rapamycin treatment in rtg3Δ cells. In contrast, Rtg3-GFP is localized constitutively to the nucleus in rtg1Δ cells, even in the absence of rapamycin addition.
Figure 8
Figure 8
(A) Msn5 is required for export of Rtg1 and Rtg3 from the nucleus. (A) msn5Δ (EY0736) and msn5Δ rtg2Δ (EY0744) cells were transformed with pRtg1-GFP (top) or pRtg3-GFP (bottom) and grown to 0.5 OD600/ml in SCD media lacking uracil and were examined by fluorescence microscopy. Rtg1-GFP and Rtg3-GFP were localized constitutively within the nucleus in msn5Δ cells but not in msn5Δ rtg2Δ cells. (B) RTG-dependent target genes remain responsive to TOR signaling in msn5Δ cells. Wild-type (K699) and msn5Δ (EY0736) cells were grown in YPD until 0.5 OD600/ml and were treated either with drug vehicle (lanes 1 and 3) or with rapamycin (lanes 2 and 4) for 30 min (this time of incubation corresponded to the peak induction of RTG-dependent gene expression observed in the rapamycin time course in Fig. 6). Cells were then harvested and RNA was prepared and analyzed by Northern blotting, probing for the specified mRNAs.
Figure 9
Figure 9
Rtg3 is a phosphoprotein and is differentially phosphorylated after rapamycin treatment. (A) Cells expressing Rtg1-HA3 (PLY047), Rtg2-HA3 (PLY089), and Rtg3-HA3 (PLY050) were grown to 0.5 OD600/ml in YPD and were treated either with drug vehicle alone or with rapamycin for 15 min. Extracts were prepared and Western blot analysis was performed using anti–HA monoclonal antibodies to detect each protein. No change in the abundance or relative mobility of Rtg1 or Rtg2 could be detected after rapamycin treatment. In contrast, a portion of Rtg3 showed an increased mobility (arrowhead) after rapamycin treatment, compared with its mobility in the absence of rapamycin (*). (B) Wild-type (K699) and rtg2Δ (EY0734) cells transformed with pRtg3-zz and were grown to 0.5 OD600/ml in SCD media lacking uracil. Cells were then treated with drug vehicle or with rapamycin for 15 min. Extracts were prepared and Rtg3-zz was immunoprecipitated with IgG-Sepharose and either mock-treated or treated with phosphatase before Western blot analysis, as indicated. Increased mobility of a portion of Rtg3-zz after rapamcyin treatment is indicated (arrowhead). (C) Wild-type (K699) cells carrying pRtg3-zz were grown to 0.5 OD600/ml in MD-glutamine or MD-urea and processed as in B. For each experiment in A–C, all samples were from the same gel. Identical results were obtained in three separate experiments.
Figure 10
Figure 10
Model for involvement of the TOR pathway in nitrogen-dependent regulation of the Rtg1 and Rtg3 transcription factors. See text for details.

References

    1. Barbet N.C., Schneider U., Helliwell S.B., Stansfield I., Tuite M.F., Hall M.N. TOR controls translation initiation and early G1 progression in yeast. Mol. Biol. Cell. 1996;7:25–42. - PMC - PubMed
    1. Beck T., Hall M.N. The TOR signalling pathway controls nuclear localization of nutrient-regulated transcription factors. Nature. 1999;402:689–692. - PubMed
    1. Beck T., Schmidt A., Hall M.N. Starvation induces vacuolar targeting and degradation of the tryptophan permease in yeast. J. Cell Biol. 1999;146:1227–1238. - PMC - PubMed
    1. Brachmann C.B., Davies A., Cost G.J., Caputo E., Li J., Hieter P., Boeke J.D. Designer deletion strains derived from Saccharomyces cerevisiae S288Ca useful set of strains and plasmids for PCR-mediated gene disruption and other applications. Yeast. 1998;14:115–132. - PubMed
    1. Cardenas M.E., Cutler N.S., Lorenz M.C., Di Como C.J., Heitman J. The TOR signaling cascade regulates gene expression in response to nutrients. Genes Dev. 1999;13:3271–3279. - PMC - PubMed

Publication types

MeSH terms