. 2000 Dec;67(6):1526-43.
doi: 10.1086/316890. Epub 2000 Nov 9.

Y-chromosomal diversity in Europe is clinal and influenced primarily by geography, rather than by language

Affiliations

Y-chromosomal diversity in Europe is clinal and influenced primarily by geography, rather than by language

Z H Rosser et al. Am J Hum Genet. 2000 Dec.

Abstract

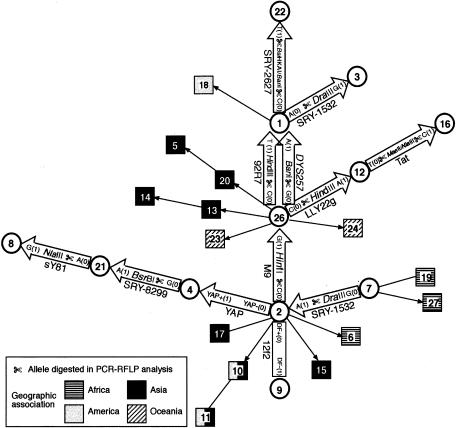
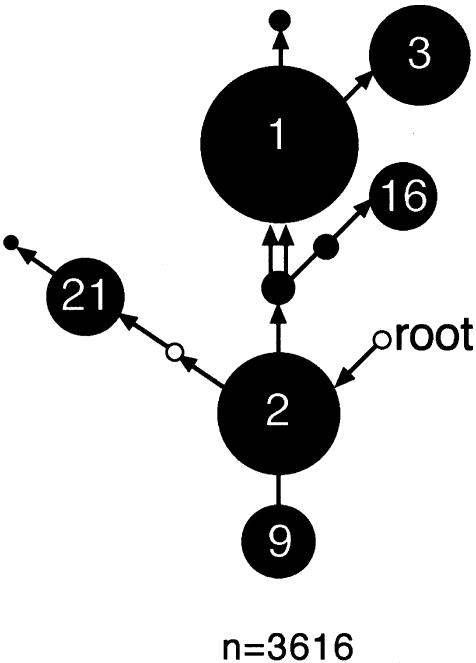
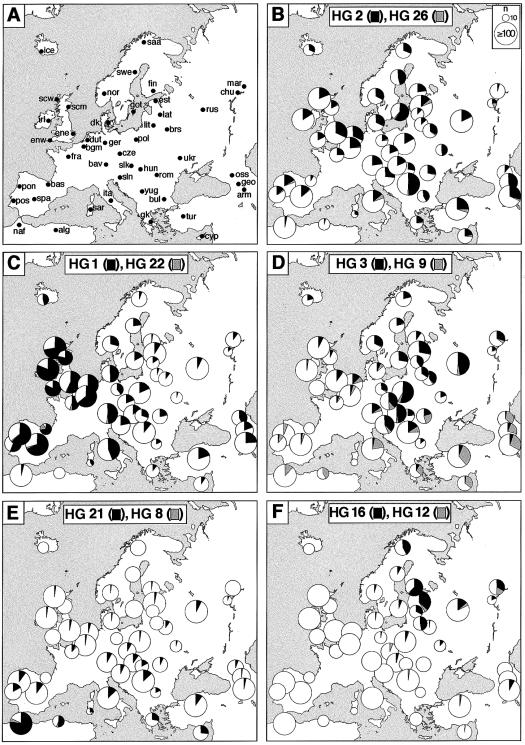
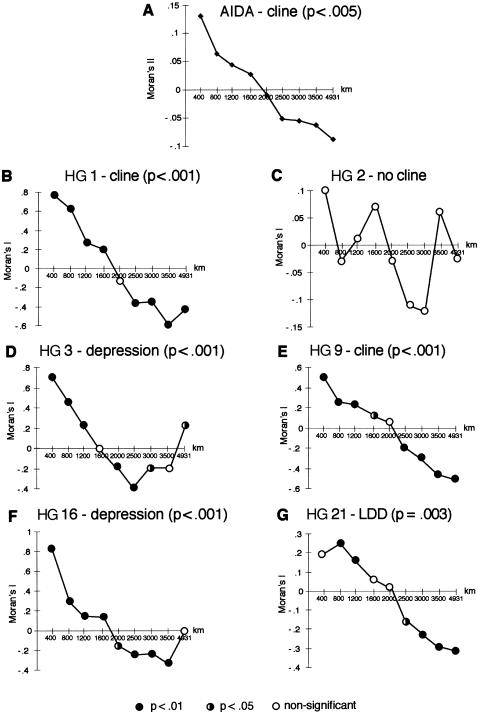
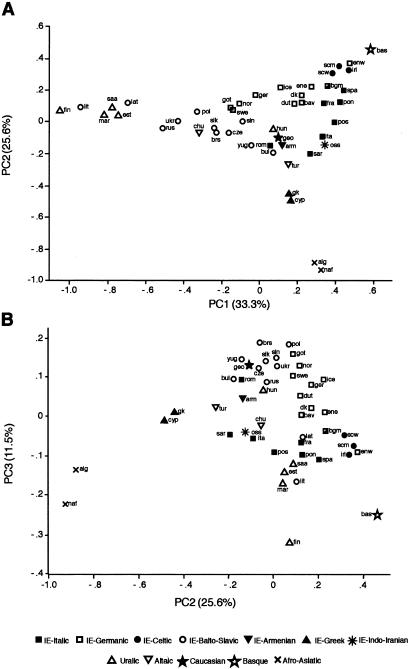
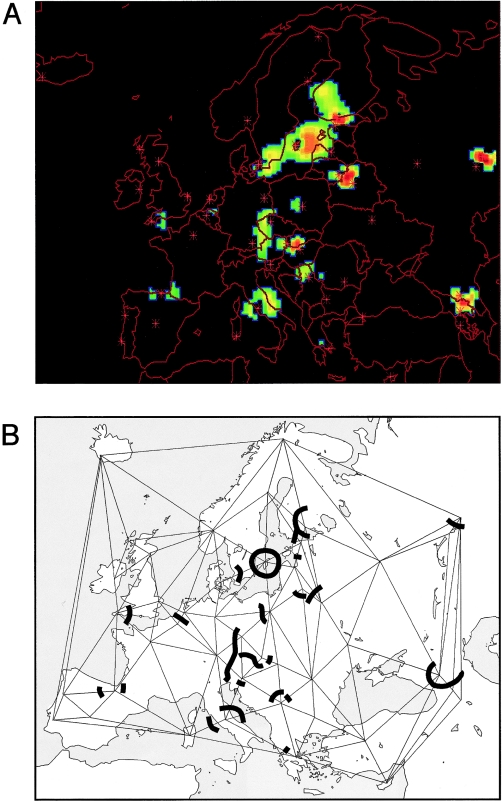
Clinal patterns of autosomal genetic diversity within Europe have been interpreted in previous studies in terms of a Neolithic demic diffusion model for the spread of agriculture; in contrast, studies using mtDNA have traced many founding lineages to the Paleolithic and have not shown strongly clinal variation. We have used 11 human Y-chromosomal biallelic polymorphisms, defining 10 haplogroups, to analyze a sample of 3,616 Y chromosomes belonging to 47 European and circum-European populations. Patterns of geographic differentiation are highly nonrandom, and, when they are assessed using spatial autocorrelation analysis, they show significant clines for five of six haplogroups analyzed. Clines for two haplogroups, representing 45% of the chromosomes, are continentwide and consistent with the demic diffusion hypothesis. Clines for three other haplogroups each have different foci and are more regionally restricted and are likely to reflect distinct population movements, including one from north of the Black Sea. Principal-components analysis suggests that populations are related primarily on the basis of geography, rather than on the basis of linguistic affinity. This is confirmed in Mantel tests, which show a strong and highly significant partial correlation between genetics and geography but a low, nonsignificant partial correlation between genetics and language. Genetic-barrier analysis also indicates the primacy of geography in the shaping of patterns of variation. These patterns retain a strong signal of expansion from the Near East but also suggest that the demographic history of Europe has been complex and influenced by other major population movements, as well as by linguistic and geographic heterogeneities and the effects of drift.


Figures

Figure 1
Figure 1
Maximum-parsimony network of Y-chromosomal biallelic HGs. Circles and squares represent compound haplotypes, or HGs; numbers within them are their arbitrarily assigned names; and arrows or lines between them represent the defining biallelic mutations. The order of occurrence of the 92R7 and DYS257 mutations is not known, because the intermediate HG has not been found; arrows for these polymorphisms are shown adjacent to each other. Where ancestral state is known, arrows point to the derived state. HGs analyzed in this study are indicated by circles; arrows or boxes between them give the nature of the mutation (0, ancestral; 1, derived), and, where appropriate, the restriction enzyme used and the allele cleaved in PCR-RFLP analysis. For HGs not analyzed (squares), information on geographic association is provided by shading. The correspondence of some of these HGs with the haplotype nomenclature of Karafet et al. (1999) and Hammer et al. (2000), whose work is referred to in the text, is as follows: HGs 1 + 22, haplotype 1C; HG 3, haplotype 1D; HG 4, haplotype 3G; HG 7, haplotypes 1A + 2; HG 8, haplotype 5; HGs 12 + 26, haplotype 1U; HG 16, haplotype 1I; HG 21, haplotypes 3A + 4; and HG 9, haplotype “Med.”
Figure 2
Figure 2
HG profile of the entire sample set. HG diversity within the complete sample set of 3,616 Y chromosomes, summarized on a simplified version of the network shown in figure 1. The area of each black circle is proportional to the frequency of the HG. Small unblackened circles indicate unobserved HGs (4 and 7). The position of the HG closest to the root (HG 7) is indicated.
Figure 3
Figure 3
Distribution of populations sampled and geographic distribution of Y-chromosomal HG diversity. A, Abbreviated population names. alg = Algerian; arm = Armenian; bas = Basque; bav = Bavarian; bgm = Belgian; brs = Belarusian; bul = Bulgarian; chu = Chuvash; cyp = Cypriot; cze = Czech; dk = Danish; dut = Dutch; ene = East Anglian; enw = Cornish; est = Estonian; fin = Finnish; fra = French; geo = Georgian; ger = German; gk = Greek; got = Gotlander; hun = Hungarian; ice = Icelandic; irl = Irish; ita = Italian; lat = Latvian; lit = Lithuanian; mar = Mari; naf = northern African; nor = Norwegian, oss = Ossetian; pol = Polish; pon = northern Portuguese; pos = southern Portuguese; rom = Romanian; rus = Russian; saa = Saami; sar = Sardinian; scm = Scottish; scw = western Scottish; slk = Slovakian; sln = Slovenian; spa = Spanish; swe = northern Swedish; tur = Turkish; ukr = Ukrainian; yug = Yugoslavian. For a list of linguistic affiliations, see table 1. B–F, HG diversity within each of 47 populations, summarized on a map of Europe. The area of each pie chart is proportional to the sample size, up to a number of ⩾100; sizes are indicated schematically within B. The area of each black or gray sector is proportional to the frequency of the corresponding HG.
Figure 4
Figure 4
Spatial autocorrelation analyses. A, Correlogram, calculated using AIDA, for the entire data set. Overall significance is given. B–G, Correlograms, calculated using SAAP, for the six most frequent HGs. The significance of each point is indicated by its symbol, and the overall significance of each correlogram is also given. LDD = long-distance differentiation. In all correlograms, the X-axes show distance classes (km).
Figure 5
Figure 5
PC analysis of Y-chromosomal HG diversity. A, PC2 plotted against PC1. B, PC3 plotted against PC2. The percentage of variance explained by each component is given on the axes. Linguistic affiliation for each population is indicated symbolically; the Belgian sample is part Dutch-/part French-speaking and has a hybrid symbol. Abbreviations are as in figure 3.
Figure 6
Figure 6
Significant Y-chromosomal genetic barriers within Europe. A, Output from the ORINOCO program. Positions of genetic barriers showing 95% significance after permutation (see the Subjects and Methods section) are indicated by blue through red areas on the black background, with sample sites indicated by stars. A three-dimensional animation of the actual output from the program can be viewed at the Molecular Genetics Laboratory of the McDonald Institute for Archaeological Research Web site. B, Schematic version of the output shown in A, with the positions of barriers indicated as thick lines on Delaunay connections (thin lines) between sample sites.

Comment in

References

Electronic-Database Information

    1. Molecular Genetics Laboratory of the McDonald Institute for Archaeological Research, http://www-mcdonald.arch.cam.ac.uk/Genetics/home.html

References

    1. Adams J, Otte M (1999) Did Indo-European languages spread before farming? Curr Anthropol 40:73–77
    1. Ammerman AJ, Cavalli-Sforza LL (1984) Neolithic transition and the genetics of populations in Europe. Princeton University Press, Princeton, NJ
    1. Barbujani G (1991) What do languages tell us about human microevolution? Trends Ecol Evol 6:151–156 - PubMed
    1. ——— (1997) DNA variation and language affinities. Am J Hum Genet 61:1011–1014 - PMC - PubMed
    1. Barbujani G, Oden NL, Sokal RR (1989) Detecting regions of abrupt change in maps of biological variables. Syst Zool 38:376–389

Publication types

Substances

LinkOut - more resources