. 2000 Nov 21;97(24):13454-9.
doi: 10.1073/pnas.240448697.

Temporal distribution of the ganglion cell volleys in the normal rat optic nerve

Affiliations

Temporal distribution of the ganglion cell volleys in the normal rat optic nerve

R Galambos et al. Proc Natl Acad Sci U S A. .

Abstract

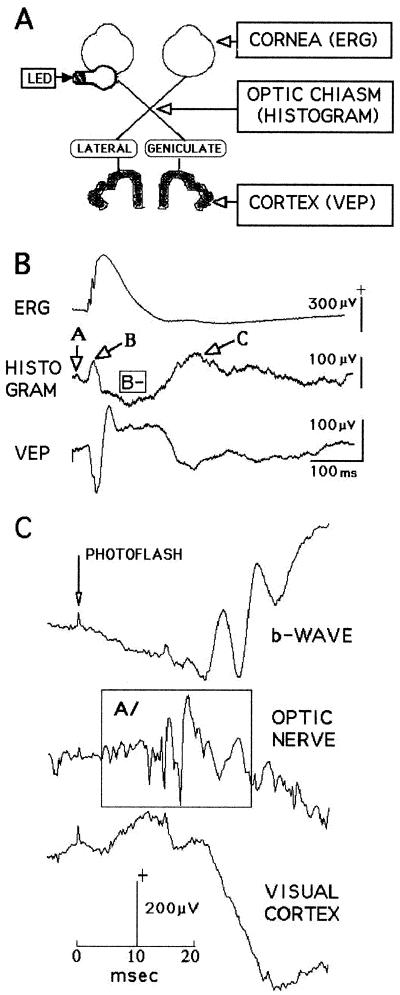
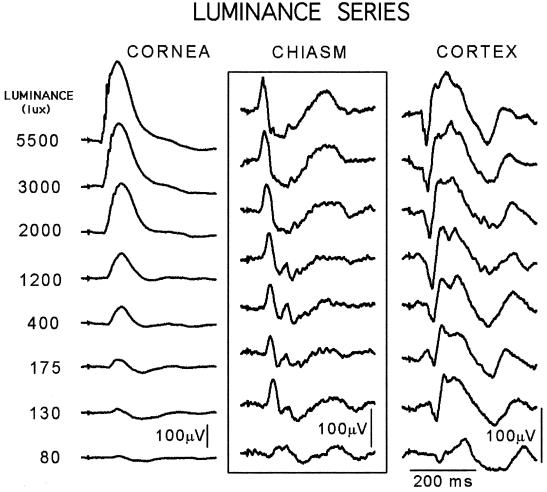
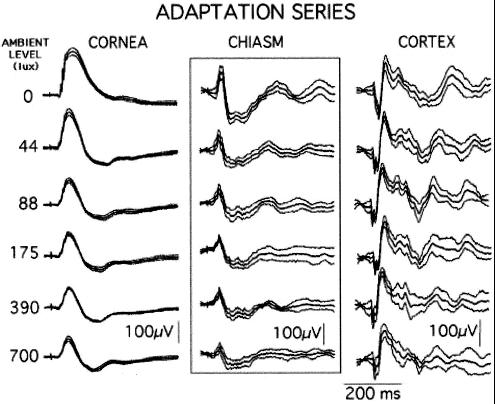
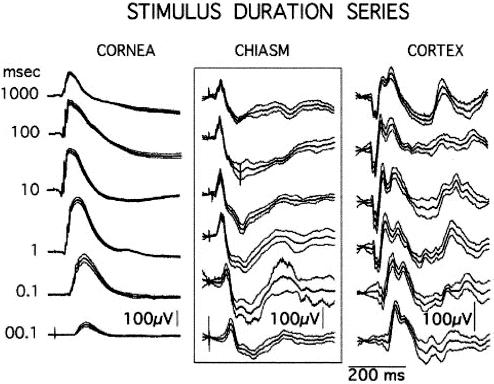
We describe experiments on behaving rats with electrodes implanted on the cornea, in the optic chiasm, and on the visual cortex; in addition, two red light-emitting diodes (LED) are permanently attached to the skull over the left eye. Recordings timelocked to the LED flashes reveal both the local events at each electrode site and the orderly transfer of visual information from retina to cortex. The major finding is that every stimulus, regardless of its luminance, duration, or the state of retinal light adaptation, elicits an optic nerve volley with a latency of about 10 ms and a duration of about 300 ms. This phenomenon has not been reported previously, so far as we are aware. We conclude that the retina, which originates from the forebrain of the developing embryo, behaves like a typical brain structure: it translates, within a few hundred milliseconds, the chemical information in each pattern of bleached photoreceptors into a corresponding pattern of ganglion cell neuronal information that leaves via the optic nerve. The attributes of each rat ganglion cell appear to include whether the retinal neuropile calls on it to leave after a stimulus and, if so when, within a 300-ms poststimulus epoch. The resulting retinal analysis of the scene, on arrival at the cortical level, is presumed to participate importantly in the creation of visual perceptual experiences.


Figures

Figure 1
Figure 1
Background information essential for understanding the experiments. (A) Diagram of the rat visual system showing where the recording electrodes were implanted. (B) Typical electrophysiological events recorded at the electrode sites after flashes delivered to the eye. At the chiasm electrode, three positive deflections, A/B/C/, and a major negative deflection, B−, appear (rat J14). (C) The earliest chiasm event, A/, has a latency of about 10 ms and precedes the appearance of the retinal b-wave (rat NO). Further details in the text.
Figure 2
Figure 2
Activity evoked at the three levels of a dark-adapted visual system by 1-ms LED flashes (n = 50) graded in luminance. At the retinal level (Left), the near-threshold flashes (bottom trace) evoked a barely visible b-wave response that increased systematically as the luminance rose through about three log units. The other output of the retina, the optic nerve activity recorded at the chiasm level (Center), behaves in an entirely different manner: its near-threshold triphasic waveshape is apparent in every suprathreshold response. The cortical activity (Right) closely resembles a mirror image of the corresponding chiasm response, as already noted in Fig. 1 (Rat J23).
Figure 3
Figure 3
Responses at the six levels to LED flashes (1 ms, n = 25) delivered to the dark- and light-adapted retina. As the ambient luminance rises, the b-wave declines in amplitude and changes its waveshape; the chiasm and corresponding cortical waveshapes decline somewhat in amplitude but retain the typical triphasic waveshape throughout. Each trace here and in Fig. 4 shows the mean ± SD (Rat J30).
Figure 4
Figure 4
Cornea, chiasm, and cortical responses (n = 25) to LED flashes varied in duration over five log units, 10 μs to 1,000 ms. The b-wave undergoes large changes whereas the chiasm and cortical responses vary relatively little in either waveshape or amplitude (Rat J30).
Figure 5
Figure 5
Chiasm responses to 1-ms LED flashes continuously delivered at rates of 1 and 3 Hz. Each trace represents the average of about 50 samples, 750 ms in duration timelocked to a flash. At the repetition rate of 1 Hz, the histogram has a duration of about 350 ms and displays typical B/, B−, and C/ deflections. The 3-Hz responses resemble the 1-Hz versions, which shows that this retina continuously created separate, complete histograms of three photoreceptor bleach patterns every second (Rat J37).

References

    1. Galambos, R., Juhász, G., Kékesi, A. K., Nyitrai, G. & Szilágyi, N. (1994) Proc. Natl. Acad. Sci. USA91(11): 5153–5157. - PMC - PubMed
    1. Paxinos G, Watson C. The Rat Brain in Stereotaxic Coordinates. 3rd Ed. San Diego: Academic; 1997. - PubMed
    1. Gottesmann C. Neurosci Biobehav Rev. 1992;16:31–38. - PubMed
    1. Yonemura D, Tsuchida Y. Jpn J Physiol. 1968;18:703–722. - PubMed
    1. Robson J G, Frishman L J. Vis Neurosci. 1995;12:837–850. - PubMed

Publication types

LinkOut - more resources