Comparative Study
. 2000 Nov 15;19(22):5971-9.
doi: 10.1093/emboj/19.22.5971.

Eukaryotic chaperonin CCT stabilizes actin and tubulin folding intermediates in open quasi-native conformations

Affiliations
Comparative Study

Eukaryotic chaperonin CCT stabilizes actin and tubulin folding intermediates in open quasi-native conformations

O Llorca et al. EMBO J. .

Abstract

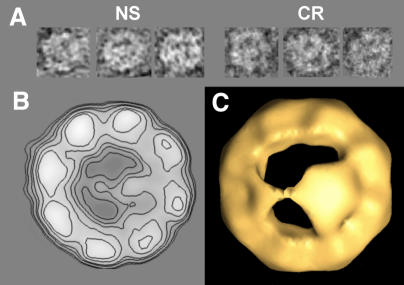
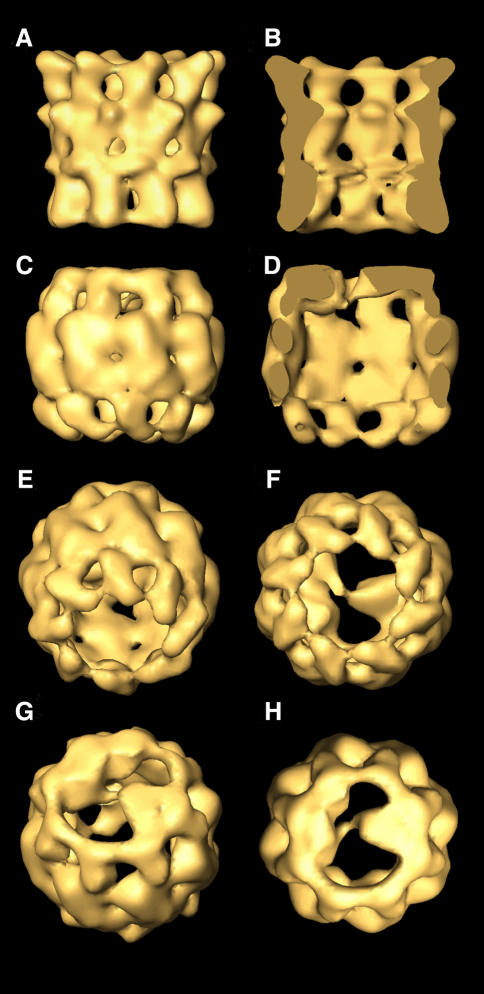
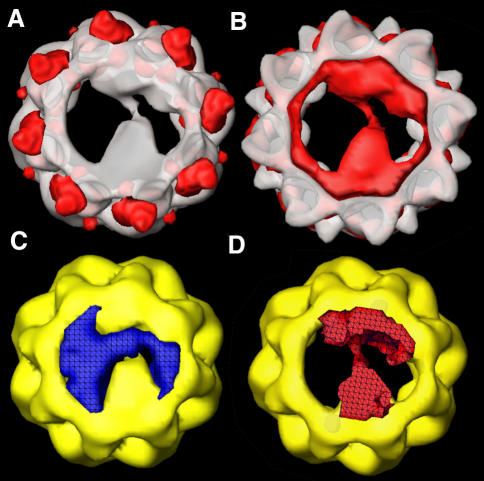
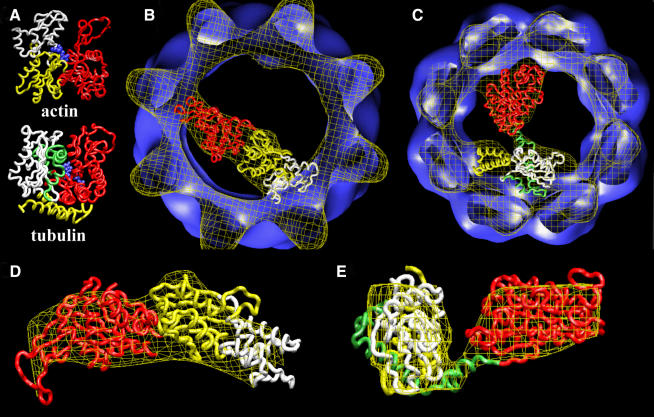
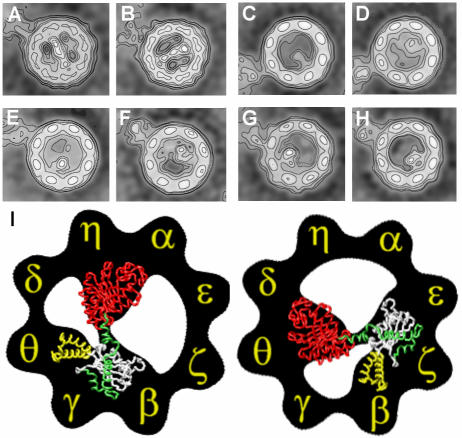
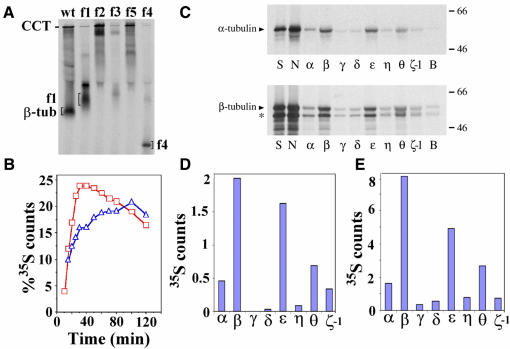
Three-dimensional reconstruction from cryoelectron micrographs of the eukaryotic cytosolic chaperonin CCT complexed to tubulin shows that CCT interacts with tubulin (both the alpha and beta isoforms) using five specific CCT subunits. The CCT-tubulin interaction has a different geometry to the CCT-actin interaction, and a mixture of shared and unique CCT subunits is used in binding the two substrates. Docking of the atomic structures of both actin and tubulin to their CCT-bound conformation suggests a common mode of chaperonin-substrate interaction. CCT stabilizes quasi-native structures in both proteins that are open through their domain-connecting hinge regions, suggesting a novel mechanism and function of CCT in assisted protein folding.


Figures

None
Fig. 1. Electron microscopy of CCT–β-tubulin complexes. (A) A gallery of top views obtained by negative staining (NS) or cryoelectron microscopy (CR). (B) Two-dimensional average of CCT–β-tubulin shown as contour lines (average of 2313 particles). (C) A view of three-dimensional reconstructions of the CCT–β-tubulin complexes obtained from stained specimens. Approximately 40 Å of the height of the CCT particle is reconstructed.
None
Fig. 2. Three-dimensional reconstructions of CCT and CCT–tubulin complexes. (A) Side view of the three-dimensional reconstruction obtained from substrate-free top views. (B) A cut along the longitudinal axis of tubulin-free CCT. (CH) Views of the three-dimensional reconstruction obtained from top views of CCT–tubulin complexes: (C) side view; (D) a cut along the longitudinal axis of the CCT–tubulin complex; (E and F) views of the tubulin-free ring; (G and H) views of the tubulin-bound ring.
None
Fig. 3. Difference maps between the three-dimensional reconstructions of apo-CCT and CCT–tubulin. (A) Difference map of apo-CCT minus the CCT–tubulin complex. The differences in mass density (red shading) are superimposed on the volume of the CCT–tubulin complex. (B) Difference map of the CCT–tubulin complex minus the apo-CCT volume. The differences in mass density (red shading) are super imposed on the volume of apo-CCT. (C and Dt-test maps of the statistical significance of the difference in mass density found in the CCT cavity when comparing apo-CCT and the CCT–tubulin three-dimensional reconstructions. Blue shading in (C) indicates the volume where no significant differences between the CCT–tubulin complex and substrate-free CCT cavities are found. Red shading in (D) shows the volume where significant differences (P <0.0005) in the cavity are found between the two three-dimensional reconstructions.
None
Fig. 4. Docking of the atomic structures of actin and tubulin. (A) Atomic structures of actin (Kabsch et al., 1990) and tubulin (Nogales et al., 1998a). Both proteins are divided into two domains: the N-terminal domain (red domain) and the C-terminal domain (yellow and white domains in actin and yellow, green and white domains in tubulin). The blue region corresponds to the nucleotide (ADP in actin, GTP in tubulin). (B) Docking of the two domains of the atomic structure of actin with the cryo-electron microscopy three-dimensional reconstruction of actin complexed to CCT (Llorca et al., 1999b). The code colours are the same as in (A), with the white domain corresponding to the fragment that permits a chimeric protein to bind strongly to CCT (β-actin.sub4) (Llorca et al., 1999b). (C) Docking of the two domains of the atomic structure of tubulin with the cryo-electron microscopy three-dimensional reconstruction of tubulin complexed to CCT (Figure 2). The code colours are the same as in (A), with the white, green and yellow domains corresponding to the tubulin fragments inserted in the chimeric proteins Ha-Ras–β-tubulin fragments 5, 3 and 4, respectively. (D) Enlarged side view of the docking of actin shown in (B). (E) Enlarged side view of the docking of tubulin shown in (C).
None
Fig. 5. Two-dimensional average images of immunocomplexes of CCT–tubulin and CCT–chimeric proteins. (A and B) Average images of CCT–tubulin–8g (anti-CCTδ) complexes (average of 527 and 491 particles, respectively). (C and D) Average images of CCT–Ha-Ras–β-tubulin fragment 5–PK-5h (anti-CCTθ) complexes (average of 345 and 381 particles, respectively). (E and F) Average images of CCT–Ha-Ras–β-tubulin fragment 3–8g (anti-CCTδ) complexes (average of 293 and 122 particles, respectively). (G and H) Average images of CCT–Ha-Ras–β-tubulin fragment 4–8g (anti-CCTδ) complexes (average of 208 and 220 particles, respectively). (I) A model depicting the two possible modes of tubulin interaction with CCT, using the CCT subunit orientation published by Liou and Willison (1997), which is fully consistent with the results obtained here. The colour codes are as in Figure 4A and C. All the average images shown in (A)–(H) are oriented as in (I).
None
Fig. 6. Interaction of α-tubulin, β-tubulin and fragments of β-tubulin with CCT following in vitro translation. (A) Native PAGE analysis of in vitro translation at 30 min time points of full-length β-tubulin (wt), Ha-Ras–β-tubulin fragment 1 (f1; red colouring in Figure 4C), Ha-Ras–β-tubulin fragment 2, a combination of fragments 3 and 5 (f2), Ha-Ras–β-tubulin fragment 3 (f3; green in Figure 4C), Ha-Ras–β-tubulin fragment 5 (f5, yellow in Figure 4C) and Ha-Ras–β-tubulin fragment 4 (f4; white in Figure 4C). The sequence of the fragments is described in Materials and methods. (B) Quantitative analysis of an in vitro translation experiment in rabbit reticulocyte lysate over 10–120 min with full-length β-tubulin (squares) and Ha-Ras–β-tubulin fragment 5 (triangles). The degree of association of translated proteins with CCT was determined by calculating the ratio between the CCT counts and the total counts in the lane. (C) Autoradiograms showing recovery of [35S]α-tubulin and [35S]β-tubulin from the 20S sucrose peak by immunoprecipitation with a set of anti-CCT subunit antibodies in NP-40 (lane N) and mixed micelle buffers (lanes α to ζ-1), as described by Hynes and Willison (2000). Lane S indicates starting sample for immunoprecipitation (i.e. 20S sucrose fraction), lane N indicates recovery of intact 35S-labelled tubulin–CCT complexes in 0.5% NP-40 and lane B indicates background signal obtained by incubation of starting sample with beads alone in mixed micelle buffer. Samples displayed on 8% SDS–PAGE gel. Molecular mass markers (kDa) are indicated in the right hand margin of the autoradiogram. The lower species (asterisk) is an internally initiated β-tubulin polypeptide. (D and E) Quantitation of recovery of [35S]α-tubulin and [35S]β-tubulin, respectively, by each anti-CCT subunit antibody in mixed micelle buffer after subtraction of background signal (signals α to ζ-1). Lanes annotated as in (C).

References

    1. Archibald J.M., Logdson,J.M. and Doolittle,W.F. (2000) Origin and evolution of eukaryotic chaperonins. Phylogenetic evidence for ancient duplications in CCT genes. Mol. Biol. Evol., 17, 1456–1466. - PubMed
    1. Bosch G., Baumeister,W. and Essen,L.O. (2000) Crystal structure of the β-apical domain of the thermosome reveals structural plasticity in the protrusion region. J. Mol. Biol., 301, 19–25. - PubMed
    1. Braig K. Otwinowski,Z., Hegde,R., Boisvert,D.C., Joachimiak,A., Horwich,A.L. and Sigler,P.B. (1994) The crystal structure of the bacterial chaperonin GroEL at 2.8 Å. Nature, 371, 578–586. - PubMed
    1. Brunger A.T. et al. (1998) Crystallography and NMR System (CNS): a new software system for macromolecular structure determination. Acta Crystallogr. D, 54, 905–921. - PubMed
    1. Bukau B. and Horwich,A.L. (1998) The hsp70 and hsp60 chaperone machines. Cell, 92, 351–366. - PubMed

Publication types

MeSH terms