

Simultaneous maps of optical action potentials and calcium transients in guinea-pig hearts: mechanisms underlying concordant alternans
- PMID: 11080260
- PMCID: PMC2270187
- DOI: 10.1111/j.1469-7793.2000.00171.x
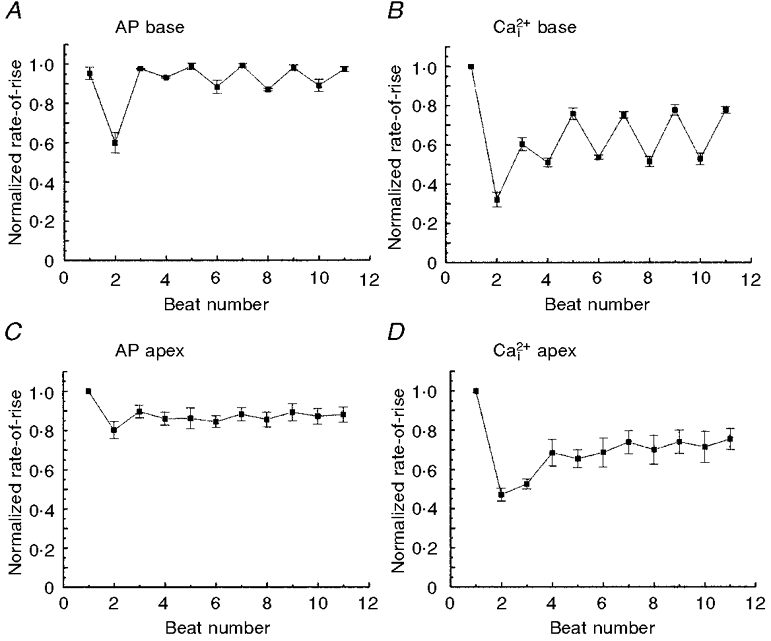
Simultaneous maps of optical action potentials and calcium transients in guinea-pig hearts: mechanisms underlying concordant alternans
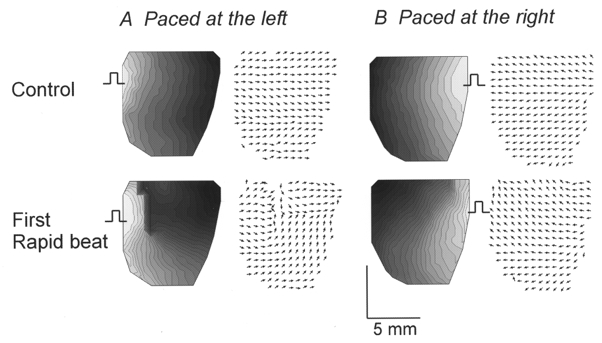
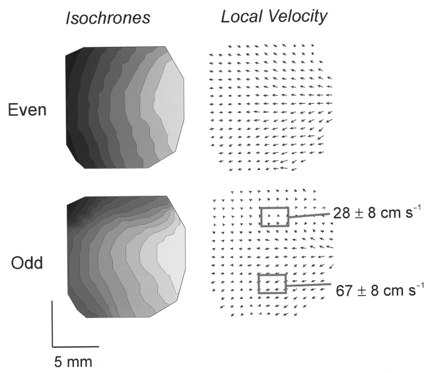
Abstract
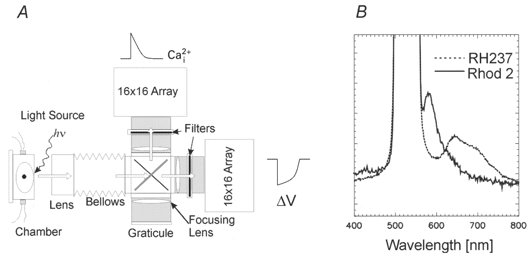
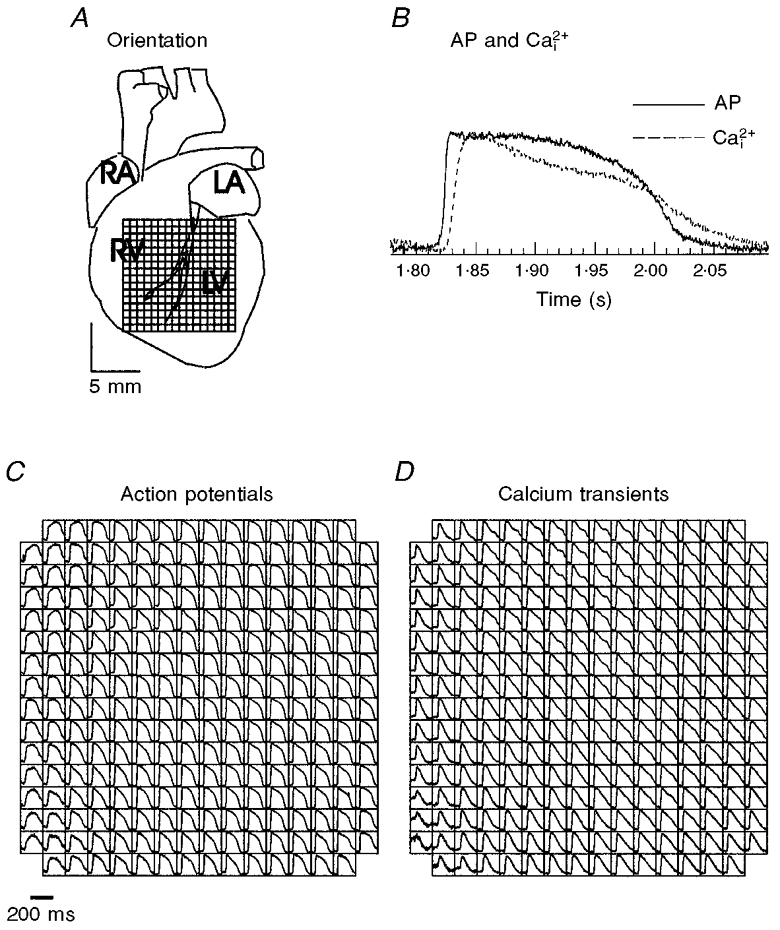
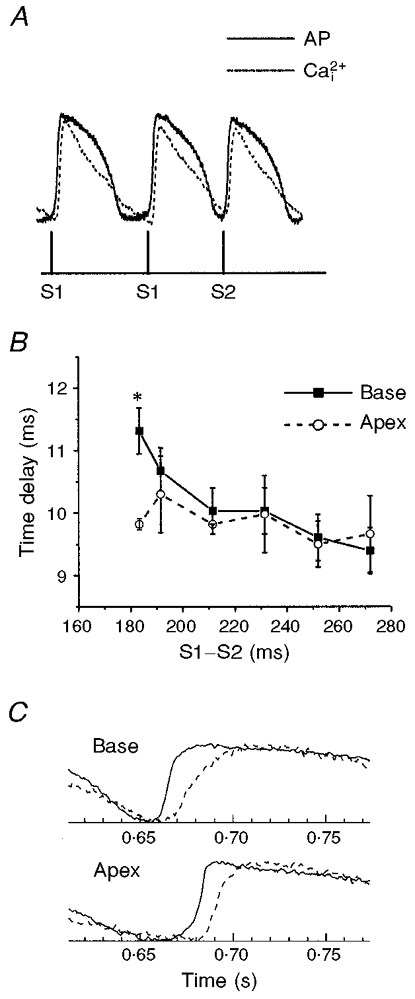
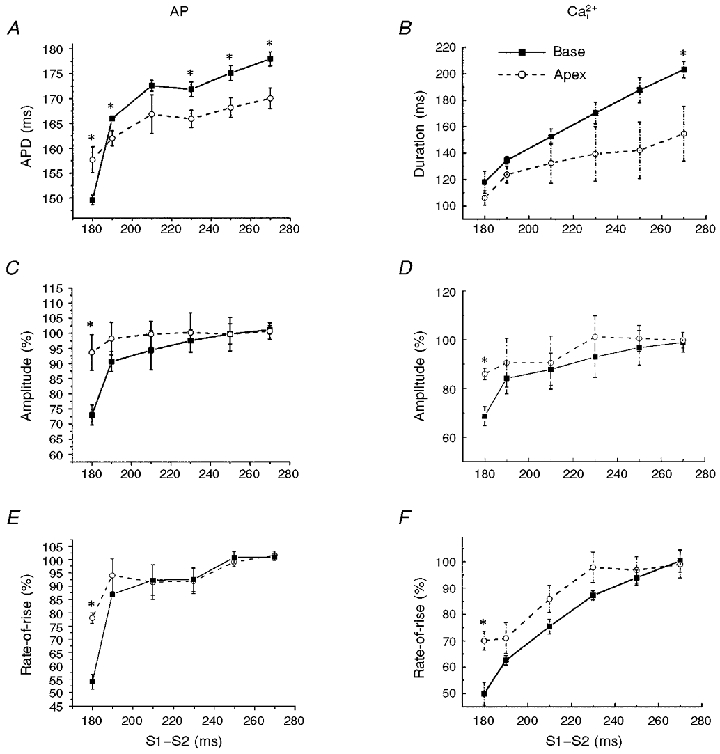
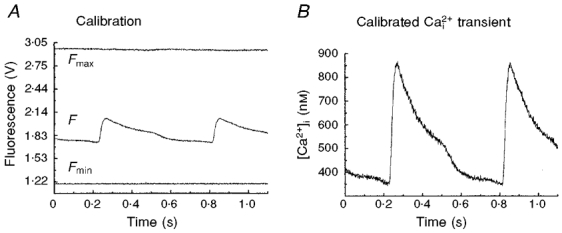
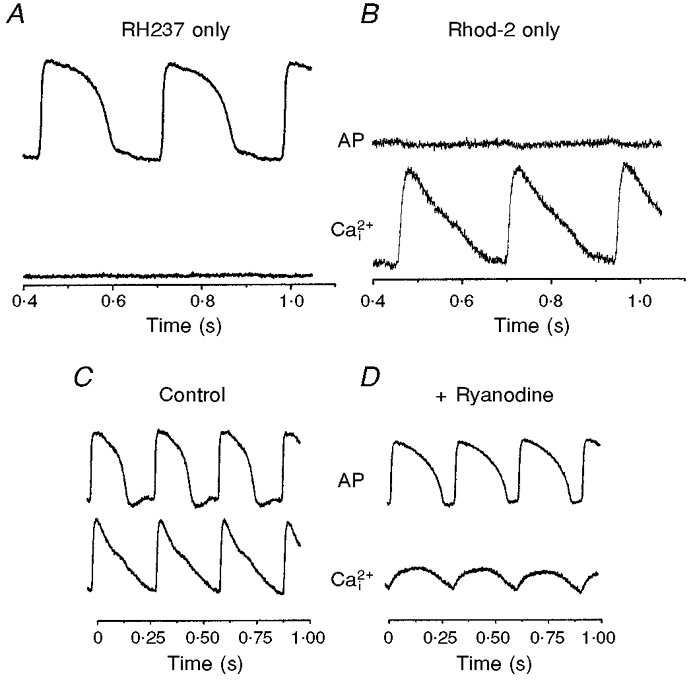
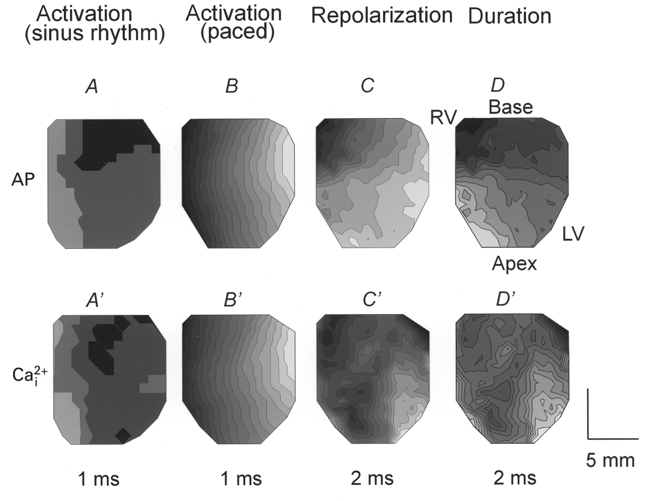
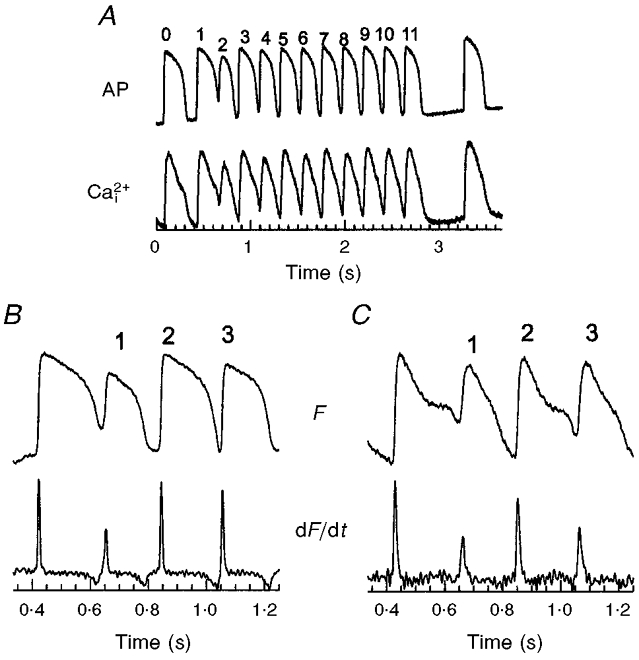
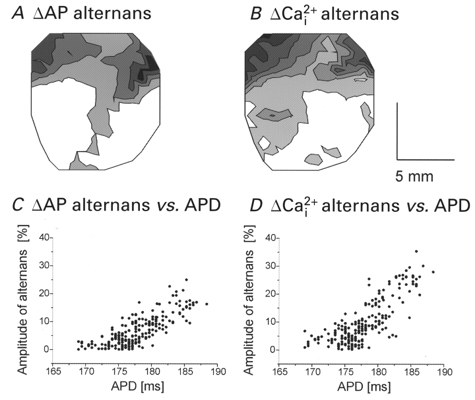
1. The mechanisms underlying electro-mechanical alternans caused by faster heart rates were investigated in perfused guinea-pig hearts stained with RH237 and Rhod-2 AM to simultaneously map optical action potentials (APs) and intracellular free Ca2+ (Ca2+i). 2. Fluorescence images of the heart were focused on two 16 x 16 photodiode arrays to map Ca2+i (emission wavelength (lamdda;em) = 585 +/- 20 nm) and APs (lamdda;em > 715 nm) from 252 sites. Spatial resolution was 0.8 mm x 0.8 mm per diode and temporal resolution 4000 frames s-1. 3. The mean time-to-peak for APs and [Ca2+]i was spatially homogeneous (8.8 +/- 0.5 and 25.6 +/- 5.0 ms, respectively; n = 6). The durations of APs (APDs) and Ca2+i transients were shorter at the apex and progressively longer towards the base, indicating a gradient of ventricular relaxation. 4. Restitution kinetics revealed increasingly longer delays between AP and Ca2+i upstrokes (9.5 +/- 0.4 to 11.3 +/- 0.4 ms) with increasingly shorter S1-S2 intervals, particularly at the base, despite nearly normal peak [Ca2+]i. 5. Alternans of APs and Ca2+i transients were induced by a decrease++ in cycle length (CL), if the shorter CL captured at the pacing site and was shorter than refractory periods (RPs) near the base, creating heterogeneities of conduction velocity. 6. Rate-induced alternans in normoxic hearts were concordant (long APD with large [Ca2+]i) across the epicardium, with a magnitude (difference between odd-even signals) that varied with the local RP. Alternans were initiated by gradients of RP, producing alternans of conduction that terminated spontaneously without progressing to fibrillation.
Figures
Similar articles
-
Role of calcium cycling versus restitution in the mechanism of repolarization alternans.Circ Res. 2004 Apr 30;94(8):1083-90. doi: 10.1161/01.RES.0000125629.72053.95. Epub 2004 Mar 11. Circ Res. 2004. PMID: 15016735
-
Modulation of ventricular repolarization by a premature stimulus. Role of epicardial dispersion of repolarization kinetics demonstrated by optical mapping of the intact guinea pig heart.Circ Res. 1996 Sep;79(3):493-503. doi: 10.1161/01.res.79.3.493. Circ Res. 1996. PMID: 8781482
-
Hypoxia and hypothermia enhance spatial heterogeneities of repolarization in guinea pig hearts: analysis of spatial autocorrelation of optically recorded action potential durations.J Cardiovasc Electrophysiol. 1998 Feb;9(2):164-83. doi: 10.1111/j.1540-8167.1998.tb00897.x. J Cardiovasc Electrophysiol. 1998. PMID: 9511890
-
Optical mapping reveals that repolarization spreads anisotropically and is guided by fiber orientation in guinea pig hearts.Circ Res. 1995 Oct;77(4):784-802. doi: 10.1161/01.res.77.4.784. Circ Res. 1995. PMID: 7554126
-
Application of the optical method in experimental cardiology: action potential and intracellular calcium concentration measurement.Physiol Res. 2013;62(2):125-37. doi: 10.33549/physiolres.932369. Epub 2012 Dec 13. Physiol Res. 2013. PMID: 23234419 Review.
Cited by
-
Simultaneous optical mapping of intracellular free calcium and action potentials from Langendorff perfused hearts.Curr Protoc Cytom. 2009 Jul;Chapter 12:Unit 12.17. doi: 10.1002/0471142956.cy1217s49. Curr Protoc Cytom. 2009. PMID: 19575468 Free PMC article.
-
Multiparametric optical mapping of the Langendorff-perfused rabbit heart.J Vis Exp. 2011 Sep 13;(55):3160. doi: 10.3791/3160. J Vis Exp. 2011. PMID: 21946767 Free PMC article.
-
A technical review of optical mapping of intracellular calcium within myocardial tissue.Am J Physiol Heart Circ Physiol. 2016 Jun 1;310(11):H1388-401. doi: 10.1152/ajpheart.00665.2015. Epub 2016 Mar 25. Am J Physiol Heart Circ Physiol. 2016. PMID: 27016580 Free PMC article. Review.
-
Epicardial wavefronts arise from widely distributed transient sources during ventricular fibrillation in the isolated swine heart.New J Phys. 2008 Jan 31;10(1):015004. doi: 10.1088/1367-2630/10/1/015004. New J Phys. 2008. PMID: 18552988 Free PMC article.
-
Basic concepts of optical mapping techniques in cardiac electrophysiology.Biol Res Nurs. 2009 Oct;11(2):195-207. doi: 10.1177/1099800409338516. Epub 2009 Jul 17. Biol Res Nurs. 2009. PMID: 19617237 Free PMC article.
References
-
- Allen SP, Stone D, McCormack JG. The loading of fura-2 into mitochondria in the intact perfused rat heart and its use to estimate matrix Ca2+ under various conditions. Journal of Molecular and Cellular Cardiology. 1992;24:765–773. - PubMed
-
- Antzelevitch C, Sicouri S, Litovsky SH, Lukas A, Krishnan SC, Di Diego JM, Gintant GA, Liu DW. Heterogeneity within the ventricular wall. Electrophysiology and pharmacology of epicardial, endocardial, and M cells. Circulation Research. 1991;69:1427–1449. - PubMed
-
- Backx PH, Gao WD, Azan-Backx MD, Marban E. Regulation of intracellular calcium in cardiac muscle. Advances in Experimental Medicine and Biology. 1993;346:3–10. - PubMed
-
- Bass BG. Restitution of the action potential in cat papillary muscle. American Journal of Physiology. 1975;228:1717–1724. - PubMed
-
- Bers DM. Excitation-Contraction Coupling and Cardiac Contractile Force. Dordrecht, The Netherlands: Kluwer; 1991.
Publication types
MeSH terms
Substances
Grants and funding
LinkOut - more resources
Full Text Sources
Miscellaneous