. 2000 Nov;124(3):959-70.
doi: 10.1104/pp.124.3.959.

Cell surface expansion in polarly growing root hairs of Medicago truncatula

Affiliations

Cell surface expansion in polarly growing root hairs of Medicago truncatula

S L Shaw et al. Plant Physiol. 2000 Nov.

Abstract

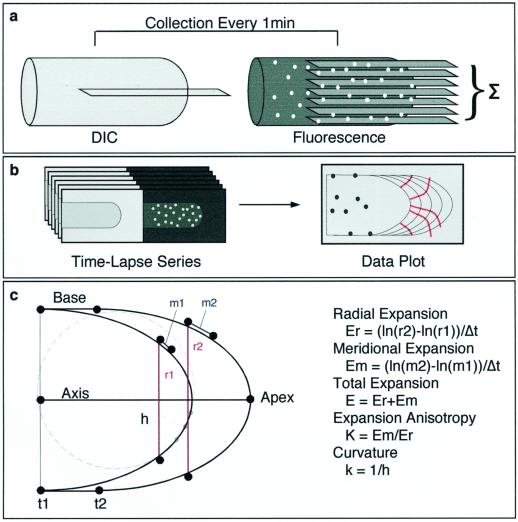
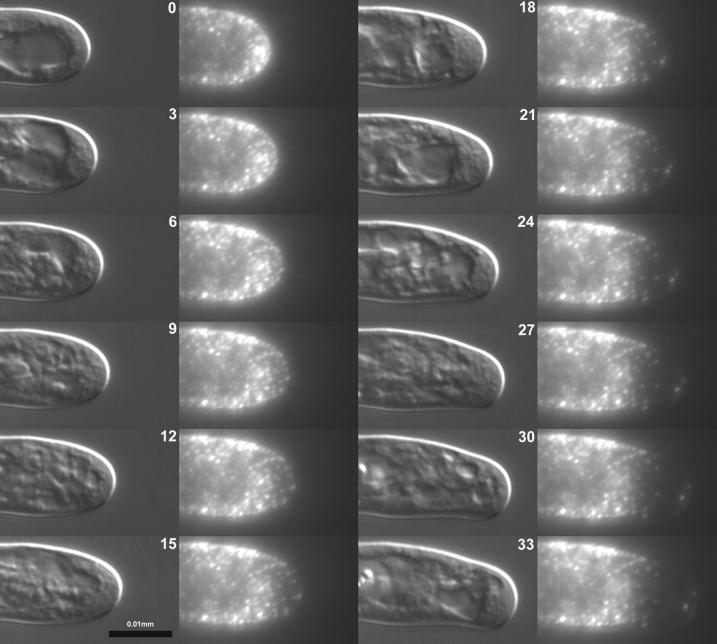
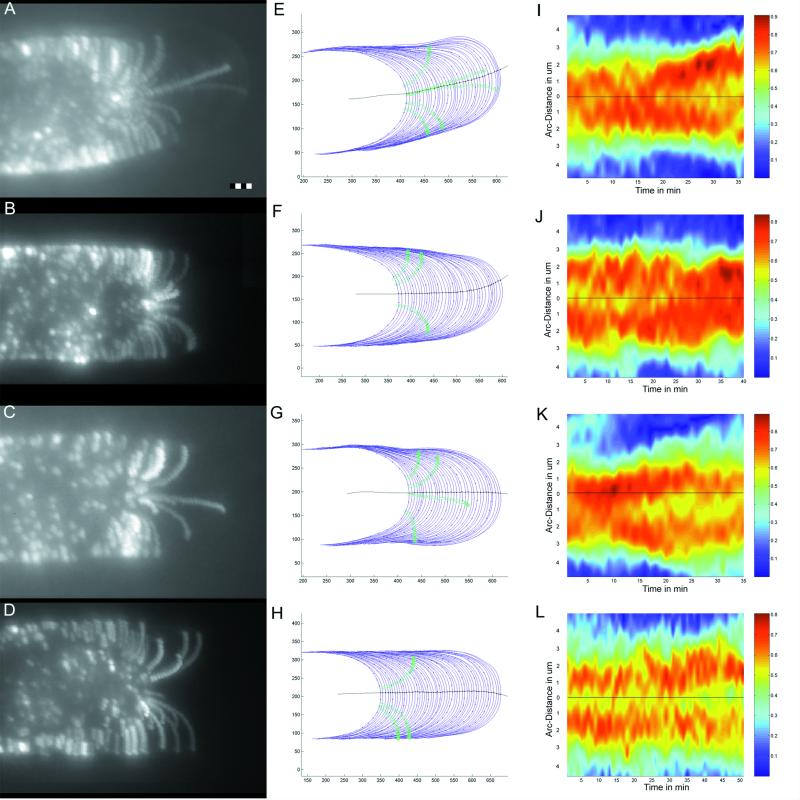
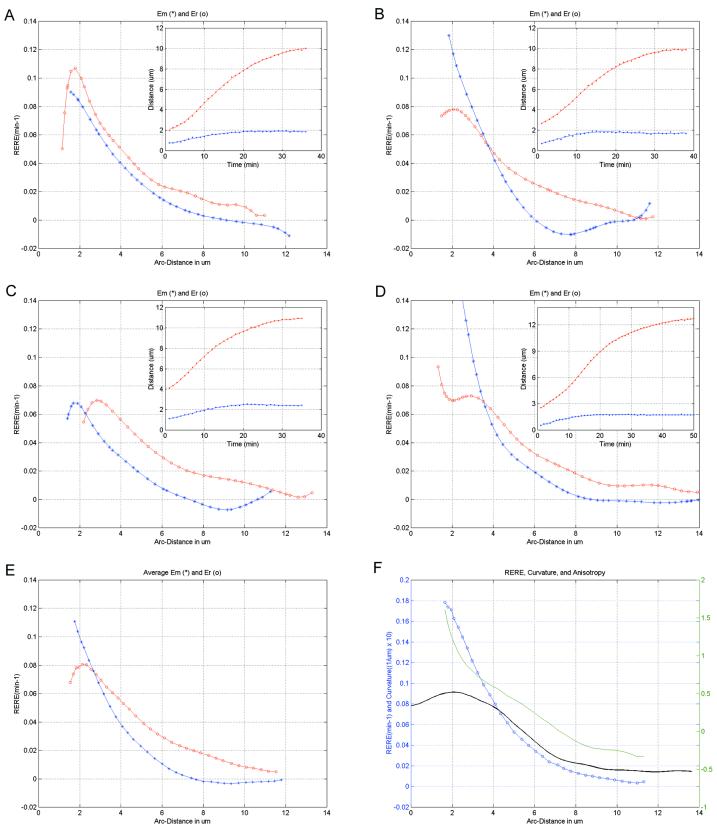
Fluorescent microspheres were used as material markers to investigate the relative rates of cell surface expansion at the growing tips of Medicago truncatula root hairs. From the analysis of tip shape and microsphere movements, we propose three characteristic zones of expansion in growing root hairs. The center of the apical dome is an area of 1- to 2- microm diameter with relatively constant curvature and high growth rate. Distal to the apex is a more rapidly expanding region 1 to 2 microm in width exhibiting constant surges of off-axis growth. This middle region forms an annulus of maximum growth rate and is visible as an area of accentuated curvature in the tip profile. The remainder of the apical dome is characterized by strong radial expansion anisotropy where the meridional rate of expansion falls below the radial expansion rate. Data also suggest possible meridional contraction at the juncture between the apical dome and the cell body. The cell cylinder distal to the tip expands slightly over time, but only around the circumference. These data for surface expansion in the legume root hair provide new insight into the mechanism of tip growth and the morphogenesis of the root hair.


Figures

Figure 1
Figure 1
Imaging and data analysis. Time-lapse microscopy of growing root hairs was performed by taking a single differential interference contrast (DIC) image in the mid-plane of the cell and seven fluorescence images as an axial series at 1.5-μm intervals (a). Fluorescence series were projected to a single plane by summation and paired with the DIC image from the same time point (b). Microsphere and cell perimeter positions were extracted using semi-automated software (c). Distance measurements were taken from extracted data points and relative elemental rates were calculated as described. Curvature was determined by dividing cell perimeters into equally spaced divisions, and finding the radius of a circle (h) fit to three adjacent points on the perimeter.
Figure 2
Figure 2
Time lapse of root hair growth. A single M. truncatula root hair from a 2-d-old seedling imaged at 10-min intervals for 15 h under constant perfusion. Extension is constant and nearly perpendicular to the root axis. Nutation, observed as small deviations from the principal growth axis, occurs throughout the image series. The cytosol is visible toward the tip of the cell during growth and redistributes after growth has ceased. Note the nuclear movement from the growing tip region to the center portion of the cell in the last panel. Bar = 25 μm.
Figure 3
Figure 3
Time lapse of bead displacement on root hair surface. A single M. truncatula root hair was decorated with sub-resolution (0.1 μm) fluorescent microspheres and imaged using differential interference contrast and fluorescence microscopies. A time-lapsed series at 3-min intervals is shown representing 33 min of growth. The cell is beginning a small turn, characteristic of nutation, downward in the frame. Microspheres originating on the apical dome move relative to each other while microspheres adhering to the cell cylinder remain stationary. Time in minutes.
Figure 4
Figure 4
Data extraction and visualization. Time-lapsed image data (1-min interval) from four experiments. Summation images from time-lapsed fluorescence sequences (see “Materials and Methods”) show the trajectories of all microspheres adhered to the surface of a growing root hair (A = 252 images summed [36 min × seven images], B = 280 images, C = 245 images, and D = 420 images). Bar = 2 μm. Cell perimeters from the associated DIC image series (blue lines) are plotted with the midline of the cell (black line) and the positions of microspheres from the fluorescence series (green circles) used for calculating relative rates of surface expansion. Scale represents pixel elements before conversion to micrometers (E–H). Dots have been placed at 1-μm intervals on every fifth cell perimeter in the outline for reference. Curvature of each cell perimeter at each time point is represented as a color-coded series (I–L). The center of the apex (black line in E–H) is drawn as a black line with the ordinate scale in micrometers. Curvature scales from low (blue) to high (red). Note the trough of lesser curvature at the cell center between two peaks of higher curvature distal to the cell apex.
Figure 5
Figure 5
Relative elemental rates of expansion. The radial and meridional rates of surface expansion calculated from the distances between microspheres on a growing root hair tip (A–D). Rates (in min−1) are plotted over the meridional distance in micrometers from the tip to the base of the apical dome. Red ○, Radial rates Er were calculated from a function fit to the distances between microspheres on the opposite sides of the apex (red line in inset). Blue *, Meridional rates (Em) were calculated using one of the same microspheres and an additional microsphere on the same side of the cell (blue line in inset). E, Mean Er and Em from A through D calculated by fitting all Em or Er data irrespective of tip size. Blue ○, Total expansion rate, obtained by adding the mean Em and Er, and growth anisotropy (green line), calculated by dividing Em/Er, are shown together with the mean curvature (black line) for A through D (F).
Figure 6
Figure 6
Proposed zones of surface expansion in the legume root hair. The root hair tip has been divided into three characteristic zones of surface expansion. The central zone (Zone 1) at the apex expands more slowly than the surrounding annular growth zone (Zone 2). Curvature reaches a global maximum at the annular growth zone (Zone 3), giving the appearance of slight shoulders to the outline of the cell. Growth in the flank of the expanding tip is anisotropic in nature, growing more in girth than in length. Circles indicate approximate relative elemental rates of surface expansion and expansion anisotropy.

Similar articles

Cited by

References

    1. Arioli T, Peng L, Betzner AS, Burn J, Wittke W, Herth W, Camilleri C, Hofte H, Plazanski J, Birch R, Cork A, Glover J, Redmond J, Williamson RE. Molecular analysis of cellulose biosynthesis in Arabidopsis. Science. 1998;279:717–720. - PubMed
    1. Bartnicki-Garcia S, Bartnicki DD, Gierz G. Determinants of fungal cell wall morphology: the vesicle supply center. Can J Bot. 1995;73:S372–S378.
    1. Bibikova T, Zhigilei A, Gilroy S. Root hair growth in Arabidopsis thaliana is directed by calcium and an endogenous polarity. Planta. 1997;203:495–505. - PubMed
    1. Brisson L, Tenhaken R, Lamb C. Function of oxidative cross-linking of cell wall structural proteins in plant disease resistance. Plant Cell. 1994;6:1703–1712. - PMC - PubMed
    1. Carpita NC, Gibeaut DM. Structural models of primary cell walls in flowering plants: consistency of molecular structure with the physical properties of the cell during growth. Plant J. 1993;3:1–30. - PubMed

Publication types

MeSH terms

LinkOut - more resources