. 2000 Nov;124(3):1191-202.
doi: 10.1104/pp.124.3.1191.

Cryo-scanning electron microscopy observations of vessel content during transpiration in walnut petioles. Facts or artifacts?

Affiliations

Cryo-scanning electron microscopy observations of vessel content during transpiration in walnut petioles. Facts or artifacts?

H Cochard et al. Plant Physiol. 2000 Nov.

Abstract

The current controversy about the "cohesion-tension" of water ascent in plants arises from the recent cryo-scanning electron microscopy (cryo-SEM) observations of xylem vessels content by Canny and coworkers (1995). On the basis of these observations it has been claimed that vessels were emptying and refilling during active transpiration in direct contradiction to the previous theory. In this study we compared the cryo-SEM data with the standard hydraulic approach on walnut (Juglans regia) petioles. The results of the two techniques were in clear conflict and could not both be right. Cryo-SEM observations of walnut petioles frozen intact on the tree in a bath of liquid nitrogen (LN(2)) suggested that vessel cavitation was occurring and reversing itself on a diurnal basis. Up to 30% of the vessels were embolized at midday. In contrast, the percentage of loss of hydraulic conductance (PLC) of excised petiole segments remained close to 0% throughout the day. To find out which technique was erroneous we first analyzed the possibility that PLC values were rapidly returned to zero when the xylem pressures were released. We used the centrifugal force to measure the xylem conductance of petiole segments exposed to very negative pressures and established the relevance of this technique. We then analyzed the possibility that vessels were becoming partially air-filled when exposed to LN(2). Cryo-SEM observations of petiole segments frozen shortly after their xylem pressure was returned to atmospheric values agreed entirely with the PLC values. We confirmed, with water-filled capillary tubes exposed to a large centrifugal force, that it was not possible to freeze intact their content with LN(2). We concluded that partially air-filled conduits were artifacts of the cryo-SEM technique in our study. We believe that the cryo-SEM observations published recently should probably be reconsidered in the light of our results before they may be used as arguments against the cohesion-tension theory.


Figures
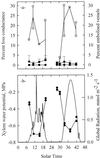
Figure 1
Figure 1
Change in xylem vessel functionality (a), water potential, and incident irradiance (b) in the petioles of a mature walnut tree during 2 consecutive d. Vessel functionality was estimated indirectly via the PLC (▪) or directly as the percentage of vessels seen air-filled on a cross-section in a cryo-microscope. Samples observed in the cryo-SEM were either frozen intact on the tree with LN2 (○) or frozen after the xylem pressure was released to zero (●). Each circle represents one sample and the lines are through the mean values. Error bars represent one sd (n = 10). Only when the xylem pressure was released prior to freezing was a good agreement found between the direct cryo-SEM and the indirect hydraulic methods.
Figure 2
Figure 2
Representative cryo-SEM observation of a walnut petiole collected at midday on a field grown tree. The petioles was frozen intact on the tree during active leaf transpiration and while the xylem water potential was around −0.7 MPa. The cross-section was observed uncoated at −150°C and 5 kV. Vessels were either entirely water filled (vessels on the left side of the picture) or one-half-filled with sap (right side). When xylem pressures were relaxed shortly before freezing all the vessels entirely filled with sap.
Figure 3
Figure 3
PLC in the xylem of walnut petioles exposed to a water stress. The water stress was provoked by exposing excised petioles to different pneumatic pressures (▪) or different centrifugal forces (○). Samples exposed to a centrifugal force were either measured while the xylem was still under centrifugal force with negative xylem pressure (○) or shortly after the xylem pressure was returned to 0 MPa (●). The error bars represent ± 1 sd. Each closed circle represents a different sample. The different techniques yielded close results. Whatever the technique, the threshold water potential for embolism induction was always less than −1.0 MPa.
Figure 4
Figure 4
Relative change in the hydraulic conductance of a petiole segment exposed to different centrifugal pressures (x axis). The conductance was measured while the segment was still under negative pressure. The arrows indicate the time course of the experiment. The segment was exposed to decreasing (black symbols) or increasing (white symbols) pressures. The hydraulic conductance decreased significantly only when the negative pressure became less than −1.5 MPa. The change in conductance was still not reversed 23 min after the petiole was exposed to zero pressure (gray symbol).
Figure 5
Figure 5
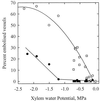
Percentage of embolized vessels present in the xylem of walnut petioles exposed to a water stress. The water stress was induced in the xylem by the transpiration pull for leaves collected in the field (squares) or by exposing excised petioles to different centrifugal forces (circles). Samples were either frozen with LN2 while the xylem was still under negative pressure (white symbols) or shortly after the xylem pressure was returned to 0 MPa (black symbols). The percentage of vessels containing air in their lumens was counted on a frozen cross-section in a cryo-SEM. Each point represents one sample. When the samples were frozen while the xylem was under negative pressures, the percentage of air-filled vessels was much higher (compare white and black symbols).
Figure 6
Figure 6
Typical results of the experiments with capillary tubes. Water-filled glass capillary tubes (a 0.25-mm internal diameter) were exposed to different centrifugal pressures (dotted line, left y axis) and suddenly frozen with LN2 (arrows). When the negative pressure was lower than approximately −0.12 MPa (top), water was expulsed out of the capillary upon freezing because of a breakdown of the water column. This caused a short cut in an electrical circuit and a voltage increased (plain line, right y axis). When the centrifugal pressure was higher than −0.12 MPa (bottom), the water column did not break.
Figure 7
Figure 7
Time course of temperature of three petiole segments immersed in a bath of liquid nitrogen at time = 0 s (plain curves). The arrows indicate the onset of the freezing exotherms. The numbers on the graph correspond to the sample diameter (millimeters). The dotted line was obtained by immersing a thermocouple directly into the LN2 bath.
Figure 8
Figure 8
Schematic drawing of the experimental set up designed for measuring the hydraulic conductance of a petiole segment exposed to a negative centrifugal pressure. A petiole segment (P) is attached to the rotor (R) of a centrifuge with the cut ends placed into two water-filled tubes (T1 and T2). Water falls from the fixed reservoir (W1) into a reservoir (W2) attached on the centrifuge. A rubber seal (S) maintains water in W2 during the rotation. Water in W2 is forced to T1 through a capillary (C) by the centrifugal force. The excess of water in T1 is evacuated through a small hole (H1) thus maintaining a constant level in T1. Because the distance (r1) between the centrifuge axis (A) and H1 is smaller than the distance (r2) between A and the hole in T2 (H2), a positive hydrostatic pressure gradient is created forcing water from T1 to T2 through the petiole. Water entering T2 is evacuated through H2 into the removable tube (T3) thus maintaining a constant level in T2. The water flow entering T3 equals the water flow through the petiole.

References

    1. Alder NN, Pockman WT, Sperry JS, Nuismer S. Use of centrifugal force in the study of xylem cavitation. J Exp Bot. 1997;48:665–674.
    1. Berndt ML, McCully ME, Canny MJ. Is xylem embolism and refilling involved in the rapid wilting and recovery of plants following root cooling and rewarming? Plant Biol. 1999;1:506–515.
    1. Böhm J. Capillarität und saftsteigen. Ber Dtsch Bot Ges. 1893;11:203–212.
    1. Briggs LI. Limiting negative pressure of water. J Appl Phys. 1950;21:721–722.
    1. Buchard C, McCully ME, Canny MJ. Daily embolism and refilling of root xylem vessels in three dicotyledonous crop plants. Agronomie. 1999;19:97–106.

LinkOut - more resources