. 2000 Nov 27;151(5):1003-12.
doi: 10.1083/jcb.151.5.1003.

Region-specific microtubule transport in motile cells

Affiliations

Region-specific microtubule transport in motile cells

A M Yvon et al. J Cell Biol. .

Abstract

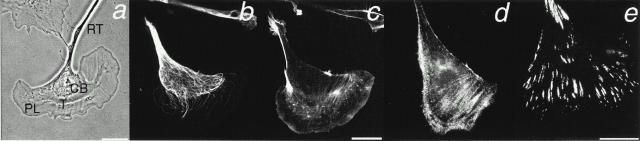
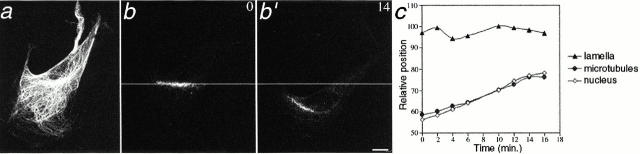
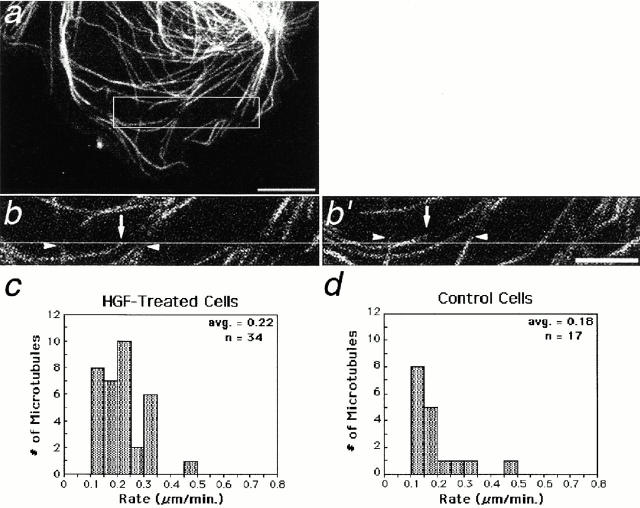
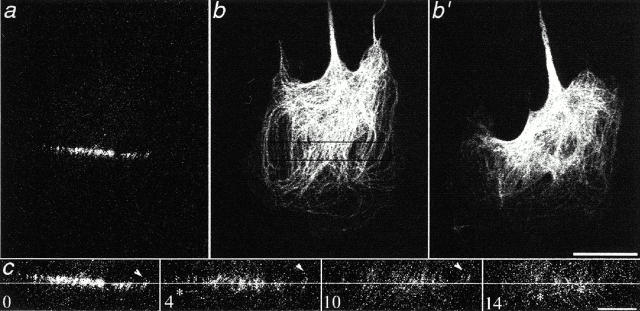
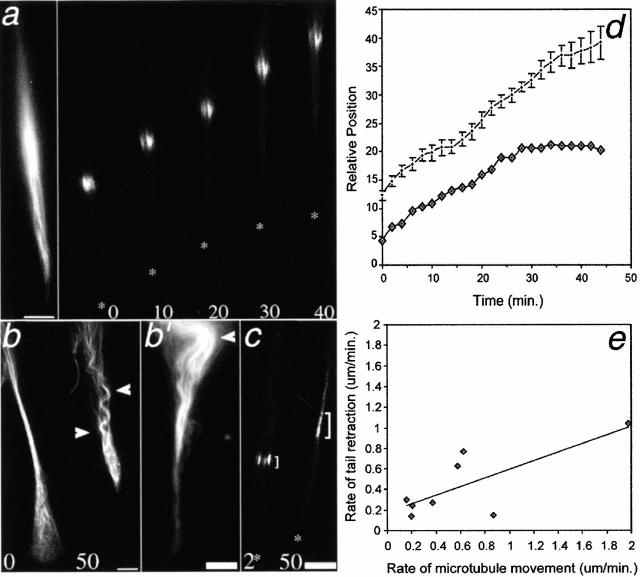
Photoactivation and photobleaching of fluorescence were used to determine the mechanism by which microtubules (MTs) are remodeled in PtK2 cells during fibroblast-like motility in response to hepatocyte growth factor (HGF). The data show that MTs are transported during cell motility in an actomyosin-dependent manner, and that the direction of transport depends on the dominant force in the region examined. MTs in the leading lamella move rearward relative to the substrate, as has been reported in newt cells (Waterman-Storer, C.M., and E.D. Salmon. 1997. J. Cell Biol. 139:417-434), whereas MTs in the cell body and in the retraction tail move forward, in the direction of cell locomotion. In the transition zone between the peripheral lamella and the cell body, a subset of MTs remains stationary with respect to the substrate, whereas neighboring MTs are transported either forward, with the cell body, or rearward, with actomyosin retrograde flow. In addition to transport, the photoactivated region frequently broadens, indicating that individual marked MTs are moved either at different rates or in different directions. Mark broadening is also observed in nonmotile cells, indicating that this aspect of transport is independent of cell locomotion. Quantitative measurements of the dissipation of photoactivated fluorescence show that, compared with MTs in control nonmotile cells, MT turnover is increased twofold in the lamella of HGF-treated cells but unchanged in the retraction tail, demonstrating that microtubule turnover is regionally regulated.


Figures

Figure 1
Figure 1
Cytoskeletal organization in HGF-treated PtK2 cells. Phase image (a) showing the general appearance and defined regions of the cell; fluorescence images showing the localization of MTs (b), F-actin (c), myosin (d) and vinculin (e). b and c are the same cell, all other panels show different cells. PL, peripheral lamella; T, transition zone; CB, cell body; RT, retraction tail. b and c, and d and e share marker bars. Bars, 20 μm.
Figure 3
Figure 3
Forward translocation of MTs in the cell body of an HGF-treated cell coinjected with rhodamine-labeled and C2CF-labeled tubulin. (a) The entire MT array at time 0 (just after photoactivation); (b and b′) the corresponding photoactivated region at the time, in minutes, indicated in the corner of each panel. (c) Plot of the position (in arbitrary units), over time, of the lamella, photoactivated MTs, and nucleus of the cell shown, emphasizing the discontinuous nature of cell movement: the lamella remains in place whereas the nucleus and MTs move forward. Bar, 10 μm.
Figure 2
Figure 2
Rearward translocation of photobleached regions in the peripheral lamella of HGF-treated cells. Cell was microinjected with rhodamine-labeled tubulin. Outlined region in a is shown at higher magnification in b and b′; horizontal lines are provided as a reference. Image in b was collected immediately after laser photobleaching; that in b′ was collected 4 min after photobleaching. Arrowheads in b and b′ show retrograde movement of photobleached marks on MTs that are perpendicular to the leading edge; arrows show retrograde movement of a parallel MT. (The direction of motility is toward the bottom of the page.) The distributions of the rates of retrograde movement in HGF-treated and control cells are shown in c and d, respectively. Bars: (a) 10 μm; (b′) 5 μm.
Figure 4
Figure 4
MTs in the transition zone of HGF-treated cells. Photoactivated MTs (a) and all MTs (b and b′) are shown in the larger panels; a and b are at 0 min after photoactivation, and b′ is at 16 min after photoactivation. Smaller panels (c) show a magnified view of the photoactivated MTs at the time shown (in minutes) after photoactivation. The box in b shows the relative location of the photoactivated MTs in a. Horizontal line is provided as a reference. Arrowheads in c indicate MTs which have moved rearward. Asterisks indicate MTs which have moved forward. (The direction of motility is toward the bottom of the page.) Many MTs remain stationary, as demonstrated by their position relative to the reference line. Bars: (a, b, and b′) 20 μm; (c) 10 μm.
Figure 5
Figure 5
Photoactivation of a nonmotile HGF-treated cell (a) and an HGF-treated cell with 20 mM BDM (b). Top panels show the entire MT array; bottom panels show the photoactivated MTs. Boxes in the top panels show initial area of photoactivation; horizontal lines in the bottom panels are provided as a reference. Time after photoactivation is given in minutes in the corner of the lower panels. MTs do not move forward in the absence of cell motility; the nucleus and some MTs (arrow) shifted slightly rearward in b due to cell rounding as a result of BDM treatment. The leading edge is toward the top of the page for both cells. Bars, 10 μm.
Figure 6
Figure 6
Photoactivated marks in the retraction tail of HGF-treated cells move toward the cell body, which is at the top of the page in a–c. (a) The mark in a steadily retracting tail moves steadily toward the cell body. The leftmost panel shows all MTs immediately after photoactivation; subsequent images show photoactivated MTs. (b) Rhodamine-labeled MTs in rapidly retracting tails buckle, indicated by arrowheads, as they are moved toward the cell body. Buckling of MTs can occur in distal (b) or proximal (b′) regions of the tail. Panels a and b′ represent the same cell; the field of view was moved toward the end of the sequence to image the junction of the tail and cell body. (c) The mark in a very slowly retracting tail widens as it is moved toward the cell body; only photoactivated MTs are shown. Brackets indicate the region measured for calculations of mark spreading. The brightness to the cell body side of the mark at 50 min is due to incorporation of photoactivated subunits; it is more apparent in this region because the MTs are very densely bundled. All times after photoactivation are given in minutes in the corner of each panel. Asterisks mark the tip of the retracting tails. (d) Graphical representation of cell shown in a and b′. The extent of widening of the photoactivated mark is inversely related to the rate of tail retraction. The position of the tip of the tail is indicated by diamonds. The position of the marked MTs and the relative width of the photoactivated mark are indicated by bars; the majority of mark widening occurs during a period of little or no tail retraction. (e) The rate of MT movement during eight periods of steady movement (see text) in seven retraction tails is loosely correlated with the rate of tail retraction during the same period. Bars, 5 μm.

Similar articles

Cited by

References

    1. Baas P.W., Brown A. Slow axonal transportthe polymer transport model. Trends Cell Biol. 1997;7:380–384. - PubMed
    1. Cramer L.P., Siebert M., Mitchison T.J. Identification of novel graded polarity actin filament bundles in locomoting heart fibroblastsimplications for the generation of motile force. J. Cell Biol. 1997;136:1287–1305. - PMC - PubMed
    1. Danowski B. Fibroblast contractility and actin organization are stimulated by microtubule inhibitors. J. Cell Sci. 1989;93:255–266. - PubMed
    1. Desai A., Mitchinson T.J. Preparation and characterization of caged fluorescein tubulin. Methods Enzymol. 1998;298:128–1320. - PubMed
    1. Euteneuer U., Schliwa M. Persistent, directional motility of cells and cytoplasmic fragments in the absence of microtubules. Nature. 1984;310:58–61. - PubMed

Publication types