. 2000 Nov 27;151(5):1047-56.
doi: 10.1083/jcb.151.5.1047.

Chromosomal addresses of the cohesin component Mcd1p

Affiliations

Chromosomal addresses of the cohesin component Mcd1p

S Laloraya et al. J Cell Biol. .

Abstract

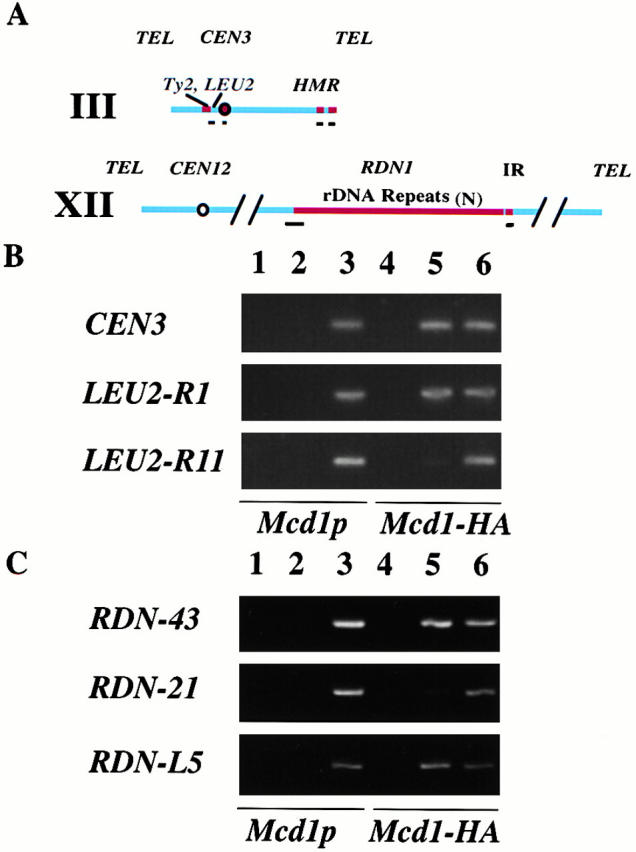
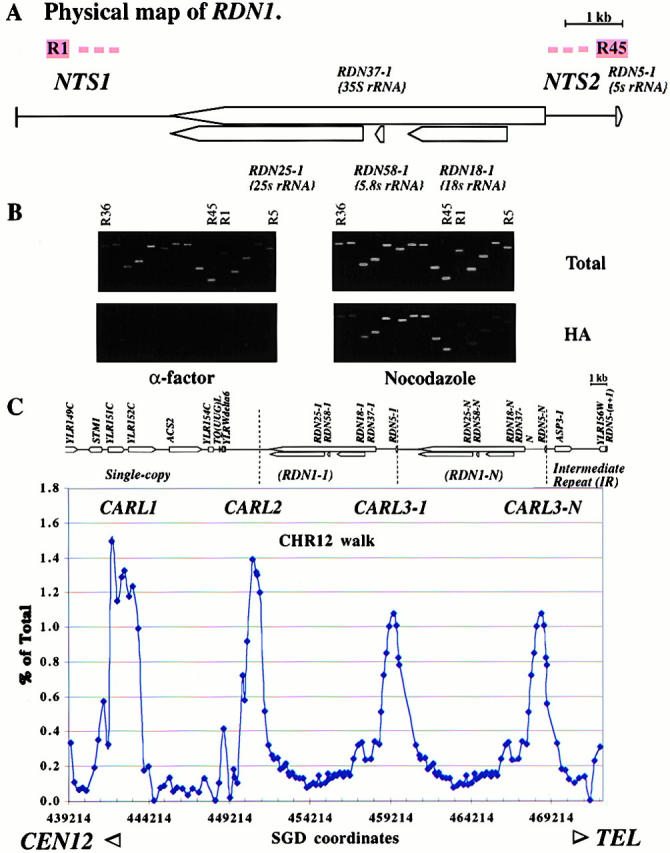
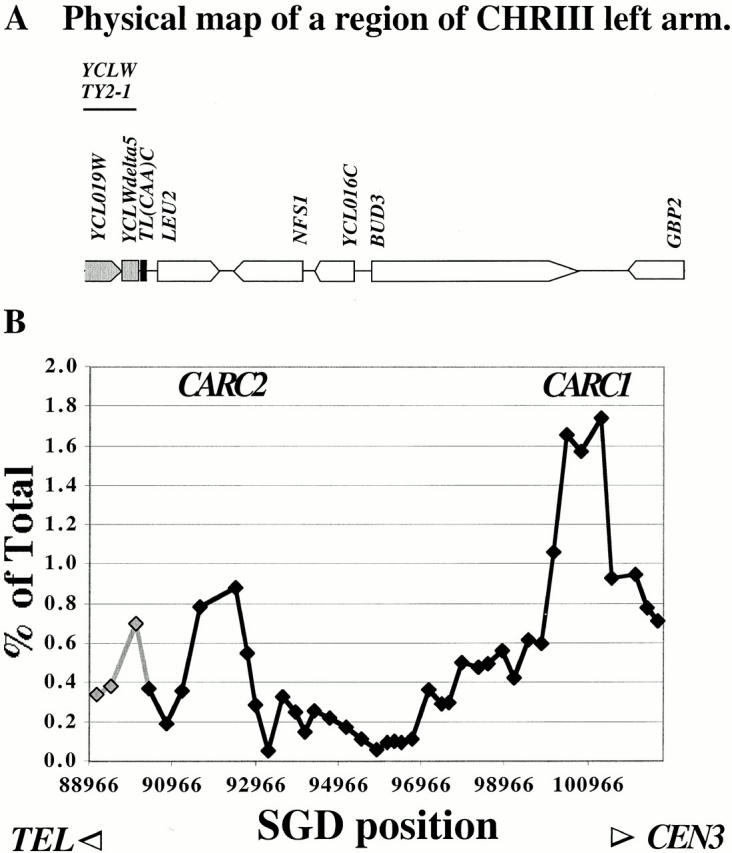
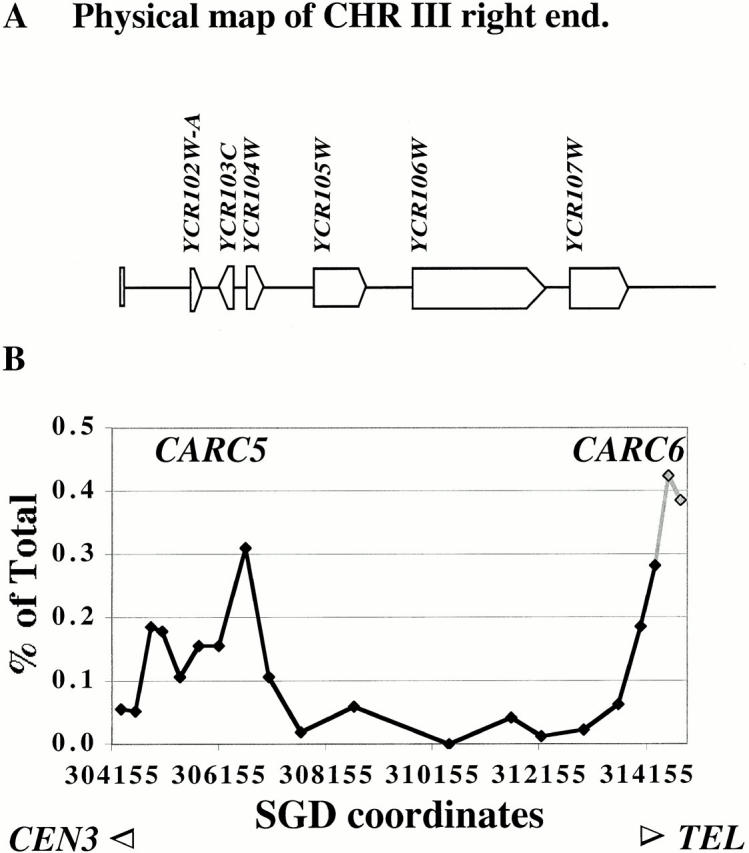
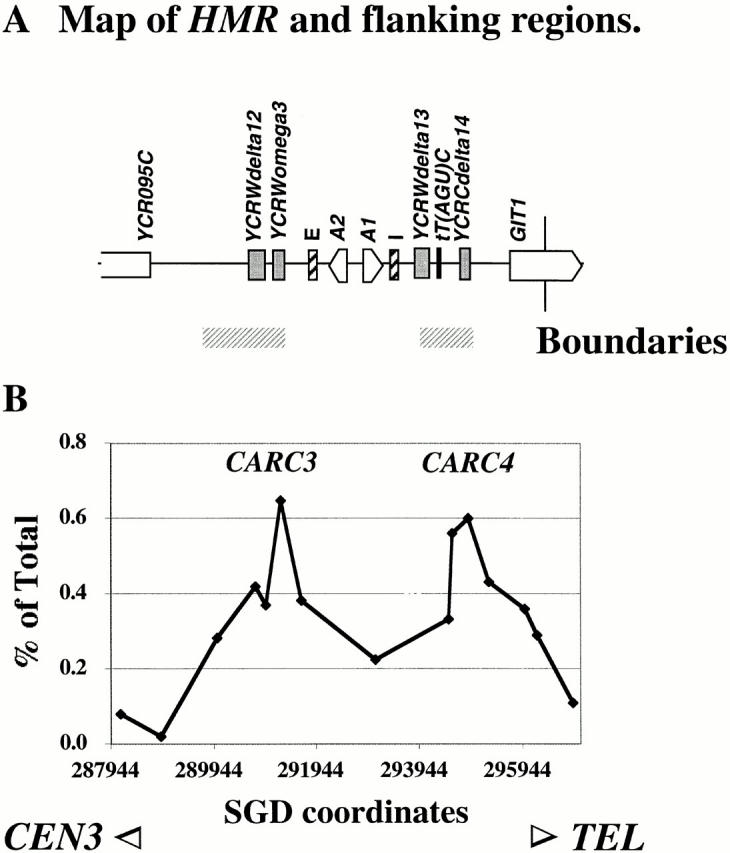
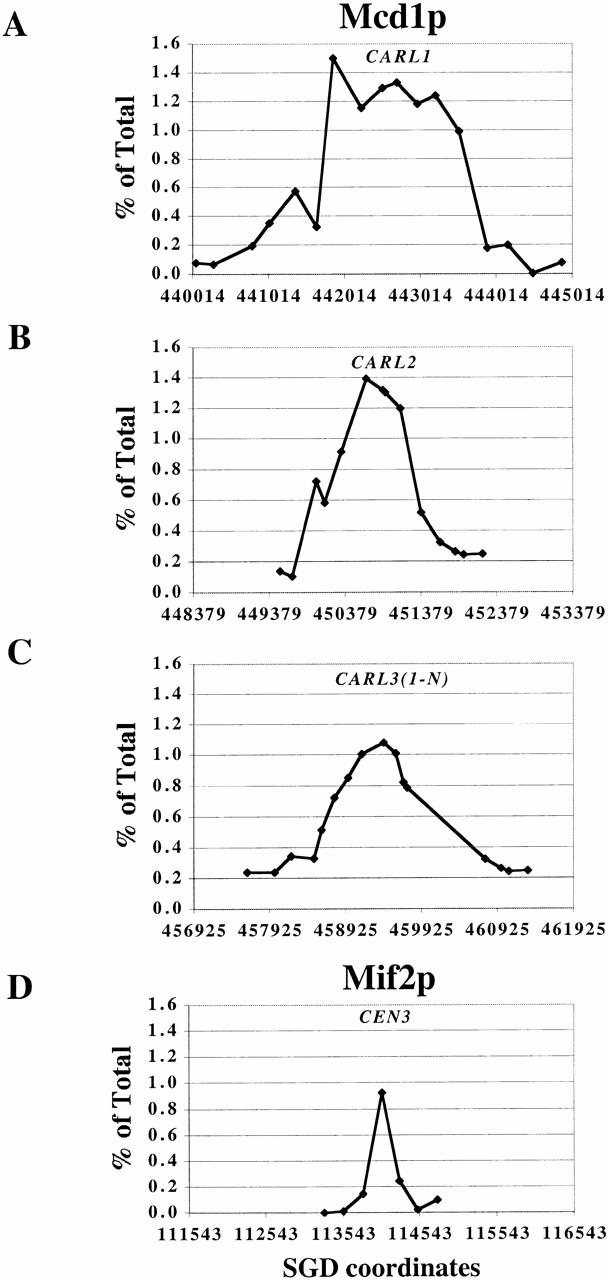
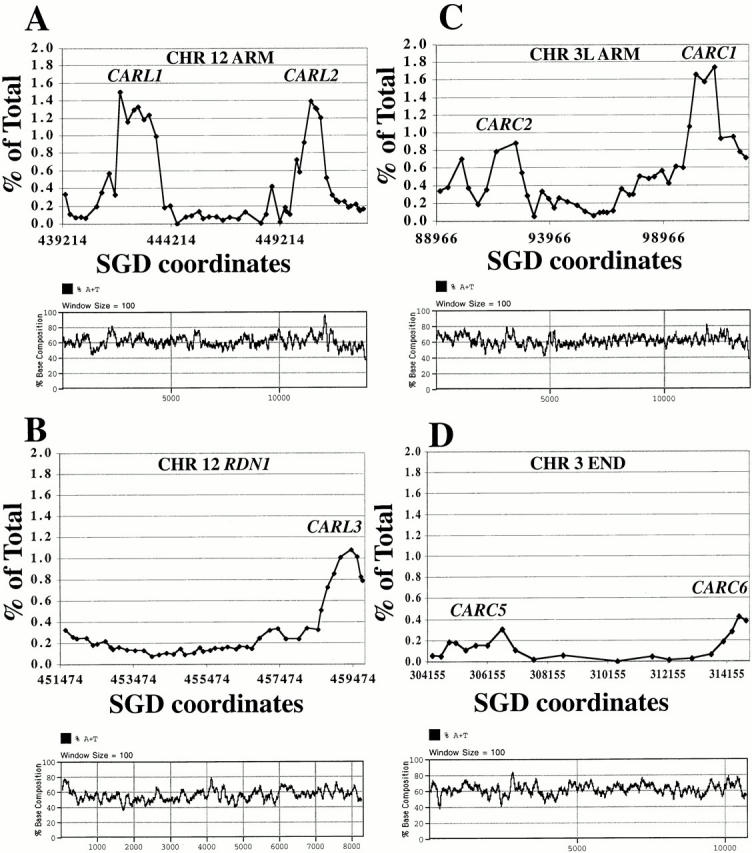
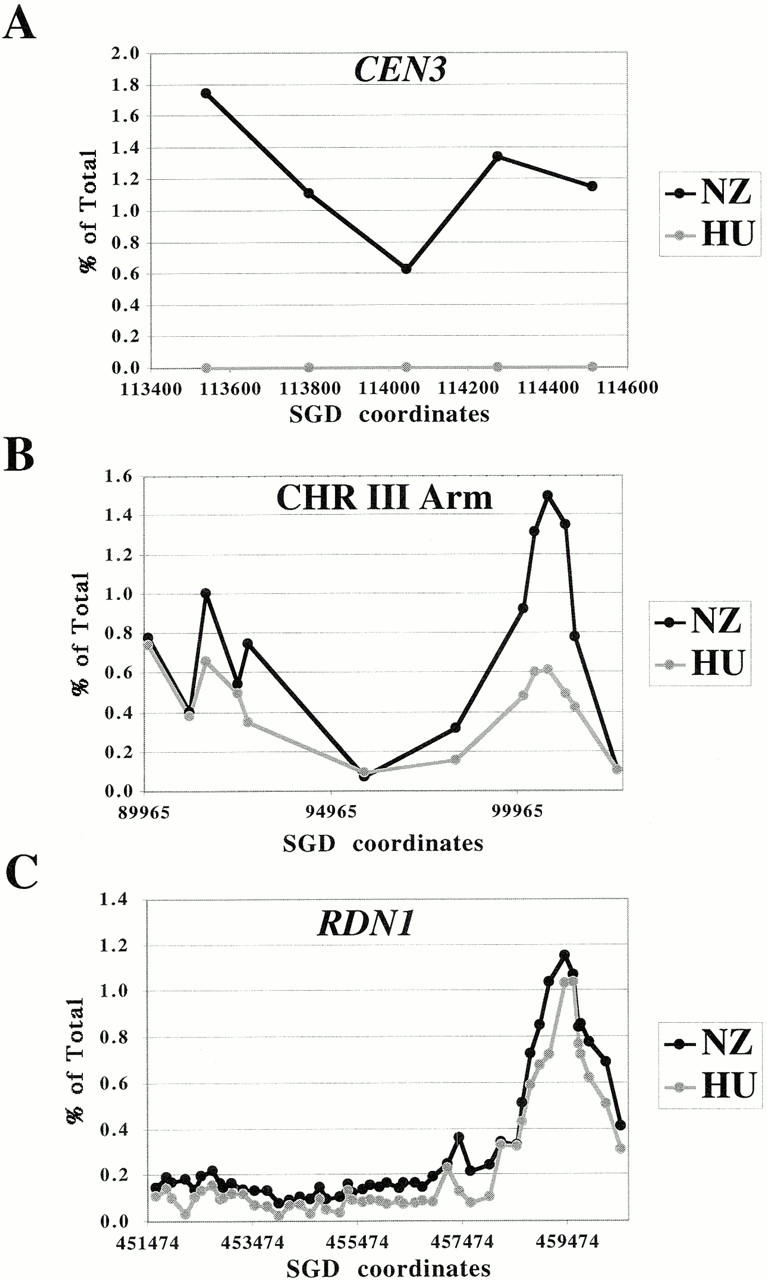
We identified the chromosomal addresses of a cohesin subunit, Mcd1p, in vivo by chromatin immunoprecipitation coupled with high resolution PCR-based chromosomal walking. The mapping of new Mcd1p-binding sites (cohesin-associated regions [CARs]) in single-copy sequences of several chromosomes establish their spacing ( approximately 9 kb), their sequestration to intergenic regions, and their association with AT-rich sequences as general genomic properties of CARs. We show that cohesins are not excluded from telomere proximal regions, and the enrichment of cohesins at the centromere at mitosis reflects de novo loading. The average size of a CAR is 0.8-1.0 kb. They lie at the boundaries of transcriptionally silenced regions, suggesting they play a direct role in defining the silent chromatin domain. Finally, we identify CARs in tandem (rDNA) and interspersed repetitive DNA (Ty2 and subtelomeric repeats). Each 9-kb rDNA repeat has a single CAR proximal to the 5S gene. Thus, the periodicity of CARs in single-copy regions and the rDNA repeats is conserved. The presence and spacing of CARs in repetitive DNA has important implications for genomic stability and chromosome packaging/condensation.


Figures

Figure 1
Figure 1
Mcd1p is associated specifically with chromosomal sequences. PCR analysis of total or coimmunoprecipitated DNA from ChIP of untagged (Mcd1p) and 6XHA-tagged MCD1 (Mcd1-HA) strains. (A) A map of chromosomes III and XII showing the regions examined. Black bars below the chromosome maps denote regions that were analyzed by PCR amplification of the chromatin immunoprecipitates. (B) The binding of Mcd1p to chromosome III centromere (CEN3) and arm (LEU2-R1 and R11) sequences. 26 cycles of PCR amplification were done using 4- or 400-fold diluted immunoprecipitated or total samples, respectively. (C) Binding of Mcd1p to selected sites (PCR fragments RDN-43 and RDN-21) on the highly repetitive rDNA and to a single-copy region (PCR fragment RDN-L5) to the left of RDN1 on chromosome XII. 22 cycles of PCR amplification were done using 4- or 400-fold diluted immunoprecipitated or total samples, respectively. Lanes: 1 and 4, mock immunoprecipitations; 2 and 5, α-HA immunoprecipitations; and 3 and 6, total chromatin solution (whole cell extract). No antibody was added in the mock immunoprecipitations.
Figure 2
Figure 2
Distribution of Mcd1p-binding sites on RDN1 and neighboring unique and intermediate repetitive sequences on chromosome XII. (A) A physical map of the RDN1 repeat unit showing various sequence features. R1 and R45, PCR fragments; NTS1 and NTS2, nontranscribed spacers 1 and 2. (B) An Mcd1p-binding site on the repetitive rDNA locus, RDN1, on chromosome XII. PCR analysis of total or Mcd1p coimmunoprecipitated DNA (HA) from α-factor or nocodazole arrested cell lysates of a region of the rDNA repeat, including the Mcd1p-binding site (PCR fragments R39–R45). PCR fragments shown are R36, R37…R44, R45, and R1…R5. (C) Mcd1p binding profile on a region of chromosome XII including a single-copy region, RDN1, and an IR. The physical map of the selected region shows ORFs and other sequence features. Two copies of the RDN1 repeat are shown for clarity, assuming that a majority of repeats are occupied. The amount of DNA immunoprecipitated estimated as the percent of total DNA is plotted on the y axis versus the position of the midpoint of each fragment on chromosome XII in bp on the x axis.
Figure 3
Figure 3
High resolution analysis of Mcd1p-binding sites on a region of chromosome III arm. (A) Physical Map of a region of the left arm of chromosome III, including LEU2 and other ORFs. Part of a full Ty2 retrotransposon inserted to the left of the LEU2 gene is shaded in gray. (B) Binding profile of Mcd1p on chromosome III arm. The amount of immunoprecipitated DNA (as percent of total) is plotted on the y axis versus DNA sequence coordinates on the x axis. The DNA sequence coordinates are aligned to the physical map in A. Gray shaded data points and line correspond to repetitive fragments within the Ty element.
Figure 4
Figure 4
Binding of Mcd1p to subtelomeric sequences of the right arm of chromosome III. (A) Map of the right end of chromosome III showing various features. (B) The binding profile of Mcd1p on the right end of chromosome III. The amount of immunoprecipitated DNA (as percent of total) is plotted on the y axis versus DNA sequence coordinates on the x axis. The DNA sequence coordinates are aligned to the physical map in A. The gray shaded part of the line corresponds to the repeated segment.
Figure 5
Figure 5
Association of HMR boundary elements with Mcd1p. (A) Map of HMR showing ORFs, silencers (I and E), and other sequence features. Previously mapped locations of the genetically defined boundaries are shown by horizontal gray bars below the map. (B) Quantification of Mcd1p binding to HMR and boundaries in mitotic cells. The amount of immunoprecipitated DNA (as percent of total) is plotted on the y axis versus DNA sequence coordinates on the x axis. The DNA sequence coordinates are aligned to the physical map in A.
Figure 6
Figure 6
Spreading of Mcd1p on various chromosomal arm sites as revealed by comparing its binding profile (top three graphs) on three CARLs on chromosome XII to the distribution of Mif2p binding to CEN3 and flanking sequences (bottom graph). The amount of immunoprecipitated DNA (as percent of total) is plotted on the y axis versus DNA sequence coordinates on the x axis. The scale of the x axis is constant in all graphs (total: 5 kb; minor division ∼1 kb).
Figure 7
Figure 7
Comparison of characteristics of various Mcd1p-binding sites. AT content of various chromosomal regions aligned with respective Mcd1p-binding profiles. Top graphs are Mcd1p-binding profiles on selected regions of chromosomes XII (left) or 3 (right). Bottom graphs in each set show fluctuations in base composition (AT content on the y axis) revealed by using a sliding window of 100 bp (x axis).
Figure 8
Figure 8
Association of Mcd1p with chromosomes in cell cycle arrested cultures. The immunoprecipitated DNA was quantified as a percent of the total lysate from HU (gray line, open circles) or nocodazole (black line, closed circles) arrested cultures. The amount of immunoprecipitated DNA (as percent of total) is plotted on the y axis versus DNA sequence coordinates on the x axis. (A) Cell cycle–dependent association of Mcd1p with CEN3 and flanking sequences. The middle fragment represents CEN3. The fold increase in binding in nocodazole arrested cells relative to HU arrested cells was tenfold or higher between different experiments. (B) Mcd1p binding to a part of the left arm of chromosome III in cell cycle arrested cells. (C) Comparison of Mcd1p binding to the entire RDN1 repeat in cell cycle arrested cells.

References

    1. Bajer A. Ciné-micrographic studies on chromosome movements in beta-irradiated cells. Chromosoma. 1958;9:319–331. - PubMed
    1. Bell S.P., Kobayashi R., Stillman B. Yeast origin recognition complex functions in transcription silencing and DNA replication. Science. 1993;262:1844–1849. - PubMed
    1. Bickmore W.A., Oghene K. Visualizing the spatial relationships between defined DNA sequences and the axial region of extracted metaphase chromosomes. Cell. 1996;84:95–104. - PubMed
    1. Blat Y., Kleckner N. Cohesins bind to preferential sites along yeast chromosome III, with differential regulation along arms versus the centric region. Cell. 1999;98:249–259. - PubMed
    1. Bryk M., Banerjee M., Murphy M., Knudsen K.E., Garfinkel D.J., Curcio M.J. Transcriptional silencing of Ty1 elements in the RDN1 locus of yeast. Genes Dev. 1997;11:255–269. - PubMed

Publication types

MeSH terms