. 2000 Nov 27;151(5):1113-8.
doi: 10.1083/jcb.151.5.1113.

Chromatin assembly at kinetochores is uncoupled from DNA replication

Affiliations

Chromatin assembly at kinetochores is uncoupled from DNA replication

R D Shelby et al. J Cell Biol. .

Abstract

The specification of metazoan centromeres does not depend strictly on centromeric DNA sequences, but also requires epigenetic factors. The mechanistic basis for establishing a centromeric "state" on the DNA remains unclear. In this work, we have directly examined replication timing of the prekinetochore domain of human chromosomes. Kinetochores were labeled by expression of epitope-tagged CENP-A, which stably marks prekinetochore domains in human cells. By immunoprecipitating CENP-A mononucleosomes from synchronized cells pulsed with [(3)H]thymidine we demonstrate that CENP-A-associated DNA is replicated in mid-to-late S phase. Cytological analysis of DNA replication further demonstrated that centromeres replicate asynchronously in parallel with numerous other genomic regions. In contrast, quantitative Western blot analysis demonstrates that CENP-A protein synthesis occurs later, in G2. Quantitative fluorescence microscopy and transient transfection in the presence of aphidicolin, an inhibitor of DNA replication, show that CENP-A can assemble into centromeres in the absence of DNA replication. Thus, unlike most genomic chromatin, histone synthesis and assembly are uncoupled from DNA replication at the kinetochore. Uncoupling DNA replication from CENP-A synthesis suggests that regulated chromatin assembly or remodeling could play a role in epigenetic centromere propagation.


Figures
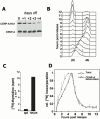
Figure 1
Figure 1
Timing of kinetochore-associated DNA replication. (A) CENP-A is a long lived protein. CENP-A–HA1 synthesis was induced in HeLa Tta-CENP-A–HA1 cells for 2 d (lane 0) and then repressed for 4 d. Cells were harvested at daily intervals (+1 through +4) and equal numbers of cells were analyzed by SDS-PAGE and Western blot using human autoimmune serum hACA-M, which recognizes both endogenous CENP-A (CENP-A) and epitope-tagged CENP-A (CENP-A–HA1). CENP-A–HA1 is stable, remaining detectable after four cell generations, and the ratio of CENP-A–HA1 to endogenous CENP-A decreases with each generation. (B) Synchrony of HeLa Tta-CENP-A–HA1 cells. Synchronized cells containing CENP-A–HA1 were released into S phase and sampled at hourly intervals. DNA content histograms reveal synchronous progression through S phase, with mitosis taking place ∼9–11 h after release. (C) Specificity of chromatin immunoprecipitation by mAb 12CA5. Asynchronously growing cultures were pulsed with [3H]thymidine for 16 h. Mononucleosomal chromatin was immunoprecipitated with mAb 12CA5 or a control mouse IgG2b. Labeled DNA was specifically recovered with mAb 12CA5. (D) Kinetochore DNA replication timing. Synchronized cells were pulse-labeled with [3H]thymidine for 30 min and then mononucleosomal chromatin was prepared for immunoprecipitation. Incorporation of [3H]thymidine into total DNA was assayed by liquid scintillation counting of 105 isolated nuclei. Data are plotted as relative values normalized to peak 3H labeling. Total DNA (○) is replicated over the course of ∼8 h, peaking 4 h into S phase. CENP-A–associated DNA synthesis (▵) lags behind total replication and peaks 5 h after release.
Figure 2
Figure 2
Spatial and temporal organization of centromere replication. HeLa Tta-CENP-A–HA1 cells were synchronized as described in the legend to Fig. 1. At hourly intervals, replicating DNA was pulse labeled with BrdU. Cells were then fixed and subjected to immunofluorescence analysis to localize DNA replication (BrdU, green) and centromeres (hACA, red). Cells representative of the five classes of S phase described by O'Keefe et al. 1992 are shown with time after release indicated at the bottom. The BrdU image was used to mask the centromere image in Photoshop®, and the resulting image (k–o) reveals centromere-associated DNA replication. Consistent with metabolic labeling, centromere replication appears to peak in the latter half of S phase. Centromeres were never the only loci undergoing replication, nor did we observe cells in which all centromeres were undergoing replication.
Figure 3
Figure 3
CENP-A accumulation occurs in G2. (A) CENP-A accumulation occurs in G2. HeLa Tta-CENP-A–HA1 cells were induced and synchronized as described above. The kinetics of histone synthesis was assayed by pulsing cells with [3H]leucine for 3 h at different times after release, showing that synthesis peaks between 3 and 6 h into S phase (top, [3H]-Leu histones). At intervals, whole cell extracts were prepared by lysis in sample buffer and subjected to SDS-PAGE and Western blotting with hACA-M, allowing detection of both CENP-A–HA1 (Epi) and endogenous CENP-A (CENP-A) (bottom). Numbers refer to the time, in hours, of sample collection. Although levels of CENP-A–HA1 remained constant, endogenous CENP-A increased in abundance beginning between 7 and 9 h after release. (B) Quantitative analysis of CENP-A accumulation. Western blots were scanned and the integrated signal intensity was determined for CENP-A–HA1 and endogenous CENP-A. CENP-A–HA1 was used to correct for lane loading differences using the ratio of CENP-A–HA1 intensity in that lane to the maximal intensity of CENP-A–HA1 in the experiment. The fold change in CENP-A (y axis, left) is plotted relative to its value at the time of release (solid black line). Values shown are the average of three independent experiments (with one standard error shown). For comparison, CENP-A–associated DNA synthesis (y axis, right), determined in Fig. 1, is plotted (solid gray line). (C and D) Histone H3 phosphorylation in synchronized cells. Parallel samples were probed for the presence of phosphorylated histone H3, a marker for late G2 and M cells. In C, significant H3 phosphorylation was detected by Western blot at 9 h after release. The fold change in phosphorylated histone H3 (bars) was estimated in one experiment, shown in D.
Figure 4
Figure 4
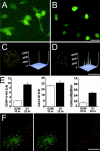
CENP-A assembles at centromeres without ongoing DNA replication. HeLa Tta-CENP-A–HA1 cells were synchronized without induction and then released into S phase while CENP-A–HA1 expression was induced. Cells were fixed after 10 h (A and C) or 22 h (B and D) and CENP-A–HA1 was detected with mAb 12CA5 (green) and endogenous centromere antigens with hACA-M (red in C and D) using three-dimensional microscopy. A and B show representative fields of cells fixed 10 h (G2 and A) or 22 h (G1 and B) after induction. Individual G2 (C) and G1 (D) cells are shown in projection for comparison. Note that for purposes of visualization the green signal intensity of G2 cells (A and C) has been increased by a factor of fivefold compared with G1 cells (B and C). To illustrate the relative signal intensities of CENP-A–HA1 in these cells, three-dimensional surface plots are shown that correspond to half of the sections projected for the cells shown in C and D. The z axis corresponds to signal intensity and the same scale is used for both. Signals reaching 12,000 on the intensity scale are observed 22 h after induction (right, D), whereas a maximum of 2,000 is found 10 h after induction (right, C). (E) Quantitative analysis of CENP-A–HA1 distribution. Five G1 and five G2 cells were analyzed for CENP-A–HA1 distribution within the nucleus. All the G2 cells analyzed were positive for phosphorylated histone H3. Incorporation was estimated using the ratio of focal fluorescence intensity (signal, S) versus nuclear background intensity (noise, N). The signal to noise ratio for CENP-A–HA1 is shown at left, with G2 in white and G1 in black bars. Note the significant increase of CENP-A–HA1 signal to noise ratio observed 22 h after induction relative to the 10-h induction. The signal to noise ratio for hACA-M staining (center) is unchanged during the cell cycle. Colocalization of newly synthesized CENP-A with centromeres was determined as the fraction of centromeric hACA-M signal contained within CENP-A–HA1 staining foci (right). Note that CENP-A–HA1 staining foci solely colocalize with centromeric sites 22 h after induction. (F) CENP-A–HA1 incorporates into centromeres in the absence of DNA replication. HeLa cells were transfected with pcDL-CA-HA1 (Shelby et al. 1997) in medium containing 5 μg/ml aphidicolin. Cells were fixed after 12 h. CENP-A–HA1 (green, center) and centromeres (red, right) were detected as above. The left panel shows the merged image where colocalization of CENP-A–HA1 with centromeres appears in yellow in the transfected cell, indicating that CENP-A assembly at centromeres can occur without ongoing DNA replication. Bars: (B) 25 μm; (D) 5 μm; (F) 2 μm.

References

    1. Barry A.E., Howman E.V., Cancilla M.R., Saffery R., Choo K.H. Sequence analysis of an 80-kb human neocentromere. Hum. Mol. Genet. 1999;8:217–227. - PubMed
    1. Brenner S., Pepper D., Berns M.W., Tan E., Brinkley B.R. Kinetochore structure, duplication, and distribution in mammalian cellsanalysis by human autoantibodies from scleroderma patients. J. Cell Biol. 1981;91:95–102. - PMC - PubMed
    1. Buchwitz B.J., Ahmad K., Moore L.L., Roth M.B., Henikoff S. A histone-H3-like protein in C. elegans . Nature. 1999;401:547–548. - PubMed
    1. Csink A.K., Henikoff S. Something from nothingthe evolution and utility of satellite repeats. Trends Genet. 1998;14:200–204. - PubMed
    1. Ekwall K., Olsson T., Turner B.M., Cranston G., Allshire R.C. Transient inhibition of histone deacetylation alters the structural and functional imprint at fission yeast centromeres. Cell. 1997;91:1021–1032. - PubMed

Publication types