. 2000 Nov;106(10):1291-300.
doi: 10.1172/JCI9900.

The proinflammatory mediator macrophage migration inhibitory factor induces glucose catabolism in muscle

Affiliations

The proinflammatory mediator macrophage migration inhibitory factor induces glucose catabolism in muscle

F Benigni et al. J Clin Invest. 2000 Nov.

Abstract

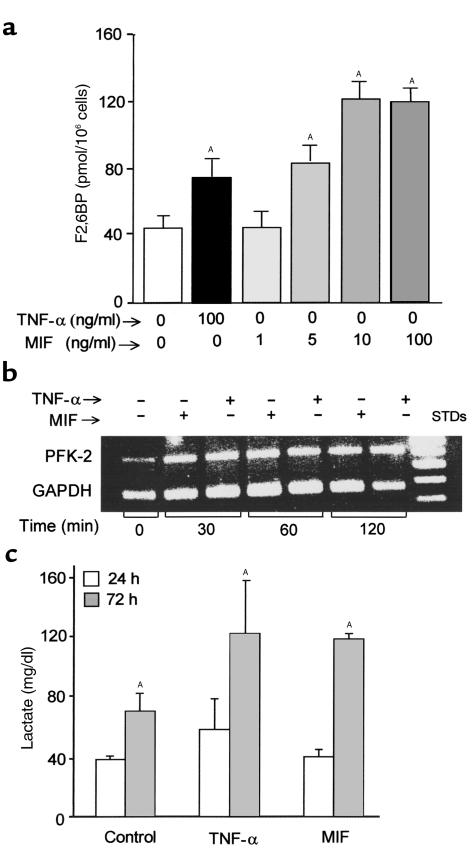
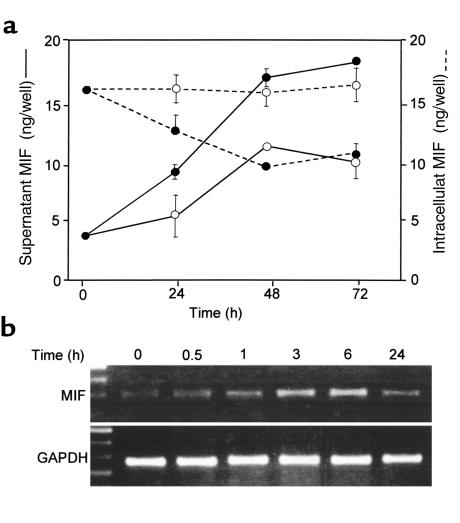
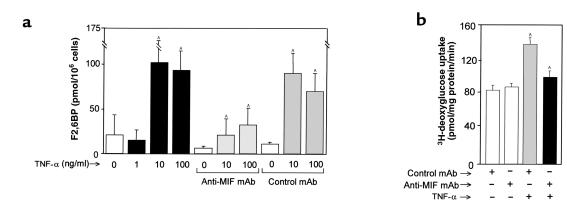
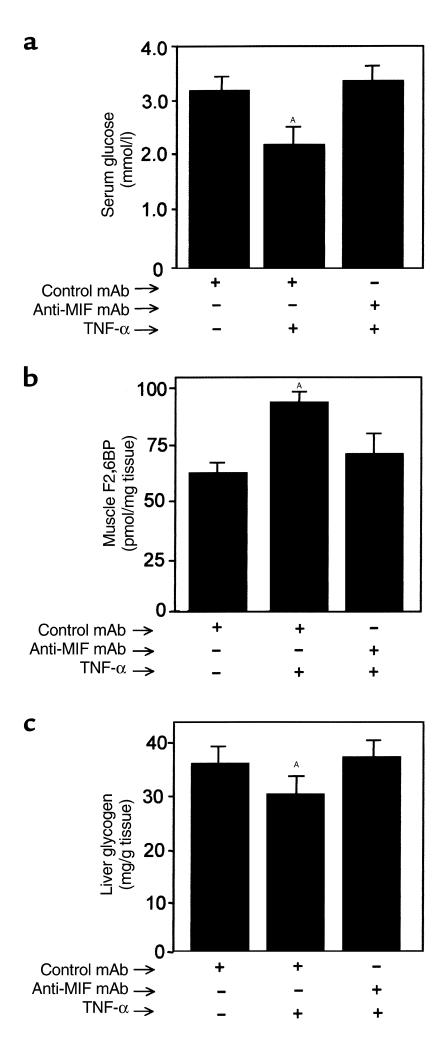
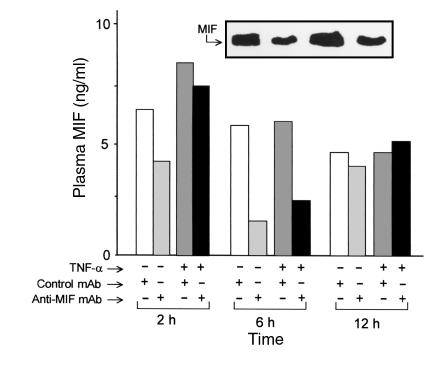
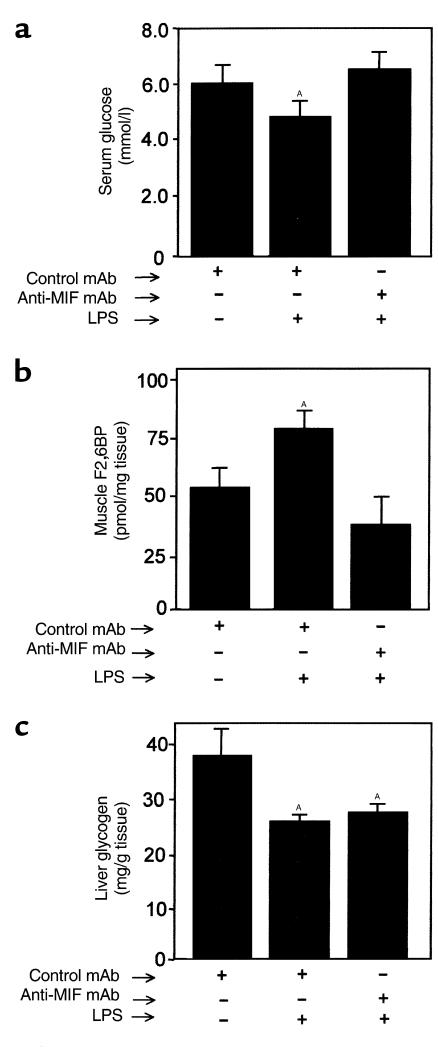
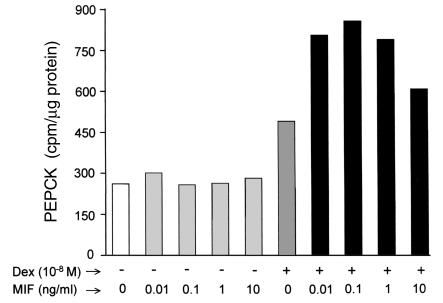
Severe infection or tissue invasion can provoke a catabolic response, leading to severe metabolic derangement, cachexia, and even death. Macrophage migration inhibitory factor (MIF) is an important regulator of the host response to infection. Released by various immune cells and by the anterior pituitary gland, MIF plays a critical role in the systemic inflammatory response by counterregulating the inhibitory effect of glucocorticoids on immune-cell activation and proinflammatory cytokine production. We describe herein an unexpected role for MIF in the regulation of glycolysis. The addition of MIF to differentiated L6 rat myotubes increased synthesis of fructose 2,6-bisphosphate (F2,6BP), a positive allosteric regulator of glycolysis. Increased expression of the enzyme 6-phosphofructo-2-kinase/fructose-2,6-bisphosphatase (PFK-2) enhanced F2,6BP production and, consequently, cellular lactate production. The catabolic effect of TNF-alpha on myotubes was mediated by MIF, which served as an autocrine stimulus for F2, 6BP production. TNF-alpha administered to mice decreased serum glucose levels and increased muscle F2,6BP levels; pretreatment with a neutralizing anti-MIF mAb completely inhibited these effects. Anti-MIF also prevented hypoglycemia and increased muscle F2,6BP levels in TNF-alpha-knockout mice that were administered LPS, supporting the intrinsic contribution of MIF to these inflammation-induced metabolic changes. Taken together with the recent finding that MIF is a positive, autocrine stimulator of insulin release, these data suggest an important role for MIF in the control of host glucose disposal and carbohydrate metabolism.


Figures

Figure 1
Figure 1
(a) Intracellular F2,6BP levels in L6 myotubes. Fully differentiated L6 muscle cells were stimulated with TNF-α (100 ng/ml) or MIF (1–100 ng/ml) for 72 hours at 37°C. Lysates were prepared and analyzed for F2,6BP content as described in Methods. Data are expressed as mean ± SD (AP < 0.05 versus control medium) of triplicate wells and are representative of three independently performed experiments. (b) Induction of rat muscle PFK-2 expression by TNF-α or MIF in L6 muscle cells, as detected by RT-PCR analysis using gene-specific primers. The amplification cycle number was varied initially in order to establish a linear amplification response, as assessed by laser densitometric analysis. (c) Lactate production by L6 myotubes. Differentiated L6 muscle cells (1.4 × 10⁶ cells per well) were stimulated with either TNF-α or MIF (each at 100 ng/ml). Supernatants were collected at 24 and 72 hours after stimulation, and the lactate levels were measured. Data are expressed as mean ± SD (AP < 0.05 versus control medium) of triplicate wells and are representative of three independently performed experiments.
Figure 2
Figure 2
(a) MIF levels in L6 muscle myotube cultures. MIF was measured by ELISA in culture supernatants (solid lines) and in cell lysates (dashed lines) after treatment with 10 ng/ml TNF-α (filled circles) versus medium alone (open circles). There were no detectable differences in cell death as assessed by viability testing with MTT (data not shown). Data are the mean (± SD) of three different experiments, each performed with triplicate cultures. For culture supernatants, P < 0.05 for all TNF-α–treated points ≥24 hours versus medium alone. Error bars are absent for those points in which the width of the error bar is less than the plotted symbol. (b) Time-dependent increase in steady-state MIF mRNA levels in L6 cells after treatment with TNF-α (10 ng/ml) as detected by RT-PCR.
Figure 3
Figure 3
(a) F2,6BP levels in cultured L6 muscle cells (1.4 × 10⁶ cells per well). Cells in triplicate wells were pretreated with medium alone, anti-MIF mAb, or control mAb, and then stimulated with TNF-α. After 72 hours of incubation, the cells were lysed and the intracellular F2,6BP concentrations measured as described in Methods. Data are the mean (± SD) of three separate experiments. AP < 0.05 versus corresponding control (TNF-α versus no TNF-α, or anti-MIF versus control mAb). (b) Deoxyglucose uptake by L6 cells 24 hours after TNF-α (10 ng/ml) stimulation. Neither anti-MIF or control mAb (100 μg/ml) alone was found to alter basal or insulin-stimulated glucose uptake. Measured values were obtained in triplicate wells and are expressed as total uptake rate. The data shown (mean ± SD) are representative of four independently performed experiments. AP < 0.05 versus each corresponding control.
Figure 4
Figure 4
(a) Serum glucose, (b) muscle F2,6BP, and (c) liver glycogen levels in mice 6 hours after TNF-α treatment. Mice (n = 5 per group) were injected intraperitoneally with 100 μg of anti-MIF mAb or isotype control antibody 2 hours before an intravenous injection of TNF-α. Data are mean ± SD and are representative of one experiment that was repeated twice. AP < 0.05 versus control mAb.
Figure 5
Figure 5
Plasma concentrations of MIF in mice pretreated intraperitoneally with anti-MIF or control mAb 2 hours before the intravenous injection of TNF-α. Plasma from each animal (n = 5 per group) was collected at 2, 6, and 12 hours after TNF-α injection, pooled, and subjected to Western blotting analysis as described in Methods. Note that the presence of anti-MIF mAb in the serum of treated animals prevented us from quantifying these samples by sandwich ELISA. A representative Western blot result for the 6-hour time point analysis is displayed in the inset. Immunoreactive bands were quantified by laser densitometry and compared with a standard curve of rMIF (1–20 ng). In a separate group of mice, we established base-line (time 0 hours) plasma MIF levels to be 2–4 ng/ml, in agreement with ref. .
Figure 6
Figure 6
(a) Serum glucose, (b) muscle F2,6BP, and (c) liver glycogen levels in TNF-α–KO mice 8 hours after LPS treatment. Mice (n = 5 per group) were injected intraperitoneally with 100 μg of anti-MIF mAb or isotype control antibody 2 hours before an intraperitoneal injection of 16.6 μg LPS/g body weight. Data are expressed are mean ± SD. AP < 0.05 versus control mAb.
Figure 7
Figure 7
PEPCK activity in rat hepatocytes stimulated with MIF, dexamethasone, or MIF plus dexamethasone. Rat hepatoma H-4-II-E cells (2 × 10⁶ cells per assay) were incubated for 6 hours with rMIF (0.1–10.0 ng/ml), or dexamethasone (10–8 M) given either alone or in combination, in which case cells were preincubated for 1 hour with rMIF before the addition of dexamethasone. Cytosolic PEPCK activity was measured as described in Methods and expressed as counts per minute per microgram of cytosolic protein. Data are a mean of two separate experiments.

References

    1. Michie HR. Metabolism of sepsis and multiple organ failure. World J Surg. 1996;20:460–464. - PubMed
    1. Rousseau GG, Hue L. Mammalian 6-phosphofructo-2-kinase/fructose-2,6-bisphosphatase: a bifunctional enzyme that controls glycolysis. Prog Nucleic Acid Res Mol Biol. 1993;45:99–127. - PubMed
    1. Furnsinn CS, et al. Acute and chronic exposure to tumor necrosis factor-α fails to affect insulin-stimulated glucose metabolism of isolated rat soleus muscle. Endocrinology. 1997;138:2674–2679. - PubMed
    1. De Blaauw I, et al. TNFα has no direct in vivo metabolic effect on human muscle. Int J Cancer. 1997;71:148–154. - PubMed
    1. Hotamisligil GS, Spiegelman BM. Tumor necrosis factor-α: a key component of the obesity-diabetes link. Diabetes. 1994;43:1271–1278. - PubMed

Publication types

MeSH terms