. 2000 Nov 21;39(46):14160-70.
doi: 10.1021/bi001799u.

pH-dependent tetramerization and amantadine binding of the transmembrane helix of M2 from the influenza A virus

Affiliations

pH-dependent tetramerization and amantadine binding of the transmembrane helix of M2 from the influenza A virus

D Salom et al. Biochemistry. .

Abstract

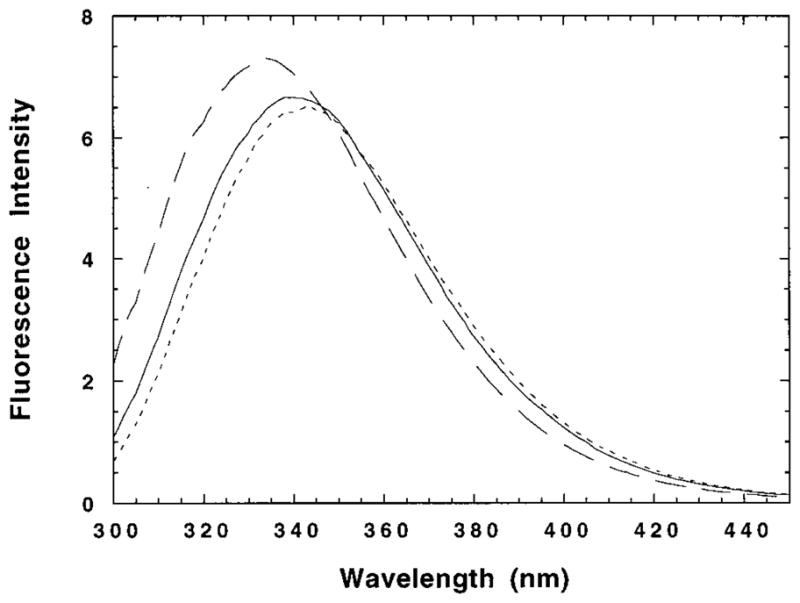
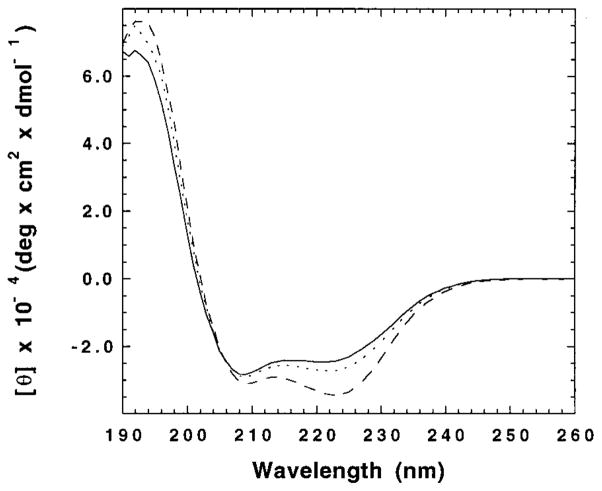
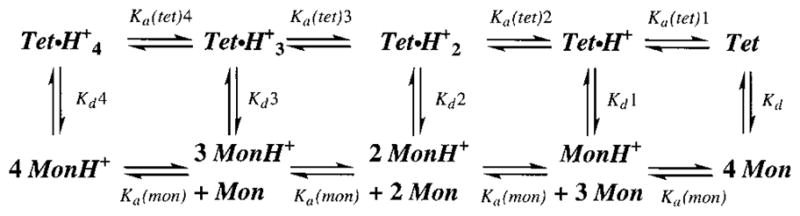
The M2 proton channel from the influenza A virus is a small protein with a single transmembrane helix that associates to form a tetramer in vivo. This protein forms proton-selective ion channels, which are the target of the drug amantadine. Here, we propose a mechanism for the pH-dependent association, and amantadine binding of M2, based on studies of a peptide representing the M2 transmembrane segment in dodecylphosphocholine micelles. Using analytical ultracentrifugation, we find that the sedimentation curves for the peptide depend on its concentration in the micellar phase. The data are well-described by a monomer-tetramer equilibrium, and the binding of amantadine shifts the monomer-tetramer equilibrium toward tetrameric species. Both tetramerization and the binding of amantadine lead to increases in the magnitude of the ellipticity at 223 nm in the circular dichroism spectrum of the peptide. The tetramerization and binding of amantadine are more favorable at elevated pH, with a pK(a) that is assigned to a His side chain, the only ionizable residue within the transmembrane helix. Our results, interpreted quantitatively in terms of a reversible monomer and tetramer protonation equilibrium model, suggest that amantadine competes with protons for binding to the deprotonated tetramer, thereby stabilizing the tetramer in a slightly altered conformation. This model accounts for the observed inhibition of proton flux by amantadine. Additionally, our measurements suggest that the M2 tetramer is substantially protonated at neutral pH and that both singly and doubly protonated states could be involved in M2's proton conduction at more acidic pHs.


Figures

Figure 1
Figure 1
Sedimentation equilibrium A280–radius profiles of M2TM in DPC micelles at 40K rpm in the (A) absence and (B) presence of 0.3 mM amantadine. The DPC concentration in all cases was 20 mM, and M2/DPC mole ratios were (a) 1/225, (b) 1/330, (c) 1/440, and (d) 1/680. The buffer was 50 mM Tris-HCl (pH 7.5) and 0.1 M NaCl. The residuals of the fits are shown in the four upper panels. The lower panels in each case show the calculated relative contributions (y-axis) of tetramers and monomers as a function of the total peptide concentration (x-axis) over the range observed in the combined experimental data.
Figure 2
Figure 2
Fluorescence emission spectra of three M2TM/DPC samples: (– – –) [M2TM]/[DPC]/[amantadine] = 1/200/10, [M2TM]/[DPC] = 1/200 (—), and [M2TM]/[DPC] = 1/2000 (- - -). The M2TM concentration was 25 μM in all samples. The excitation wavelength was 280 nm. The buffer was 50 mM Tris-HCl (pH 8) and 0.1 M NaCl.
Figure 3
Figure 3
CD spectra of three M2TM/DPC samples: [M2TM]/[DPC] = 1/2000 (—), [M2TM]/[DPC] = 1/100 (···), and [M2TM]/[DPC]/[amantadine] = 1/100/10 (– – –). The M2TM concentration was 50 μM in all samples. The buffer was 50 mM Tris-HCl (pH 8) and 0.1 M NaC1.
Figure 4
Figure 4
Peptide to detergent ratio dependence of tetramerization equilibrium at pH 8 with 50 μM peptide. (A) Ratio of the measured CD ellipticity at 223 nm to that at 209 nm (r). White circles are without amantadine, and black circles are with a constant 1/10 amantadine/detergent mole fraction. Lines are calculated from the equilibrium dissociation model by globally fitting data (with and without amantadine) at 10 different peptide/detergent ratios with a fixed pH of 8.0 and a peptide concentration of 50 μM (this figure), at 10 different pH’s (one point at pH 8.9 without amantadine was omitted from the fit to avoid its undue influence on pK values) with a fixed 1/100 peptide/detergent mole ratio (see Figure 7), and with 10 different amantadine concentrations (see Figure 6) at pH 8.0 and a peptide/detergent ratio of 1/400. Fits were obtained by fixing the monomer pKa to 6.77 (determined by NMR) and fixing pKa(tet)2 to 5.7 (estimated from electrophysiology data). Molar ellipticity parameters were fit using the pH-dependent data in this figure, and the other parameters were determined by global fitting of all data sets. Details of the procedure are available as Supporting Information: pKa(mon) = 6.77, pKd = 6.92, pKa(tet)1 = 6.4 ± 0.7, pKa(tet)2 = 5.7, pKd(Aman) = 5.8 ± 0.1, and AmanPartCoeff = 233 ± 30. (B) Calculated species distribution for panel A equilibria with no amantadine detergent. (C) Calculated species distribution for panel A equilibria with a 1/10 mole fraction of amantadine detergent. Species not indicated in these panels were computed to be at negligible levels.
Figure 5
Figure 5
(A and B) CD spectra of a sample in 25 μM peptide in 10 mM DPC micelles in 50 mM Tris-HCl (pH 8) and 0.1 M NaCl without amantadine (—) and at equilibrium with 1 mM amantadine (– – –): (A) M2TM and (B) the (V27S)M2TM mutant. (C) Kinetics of amantadine-induced CD changes at 223 nm for M2TM (○) and (V27S)M2TM (●), in the samples described above.
Figure 6
Figure 6
Titration of M2TM with amantadine, monitored by the ratio of θ223 to θ209 (r). The peptide concentration was 50 μM; the DPC concentration was 20 mM, and the buffer was 50 mM Tris-HCl (pH 8) and 0.1 M NaCl. The line is calculated from parameters obtained from global fitting as described in the legend of Figure 4.
Figure 7
Figure 7
pH titration. (A) Ratio of the measured θ223 to θ209 (r). The lines were calculated from the equilibrium dissociation model using the parameters described in the legend of Figure 4. Peptide and DPC concentrations were 0.1 and 10 mM, respectively. White circles are without amantadine, and black circles are with 1 mM amantadine. (B) Calculated species distribution for panel A equilibria with no amantadine case. (C) Calculated species distribution for panel A equilibria with a 1/10 mole fraction of amantadine detergent. Species not indicated in these panels were computed to be at negligible levels.
Figure 8
Figure 8
Proton chemical shift of the His37 δ2 proton of 200 μM M2TM in DPC-d38 micelles ([M2TM]/[DPC] = 1/1000) as a function of pH. The line is the fit to single-proton dissociation model (pKa = 6.77) assuming that the chemical shift is a linear function of the fractional degree of protonation.
Figure 9
Figure 9
Normalized chord conductance vs pH from electrophysiological measurements of M2 currents in transfected mammalian cells (●) (17). The solid line was computed by curve fitting using the conductance definition used by Chizhmakov et al. (17) and the current–voltage model described in the text for a fixed pKa(tet)1 of 6.4 and a pKa(tet)2 of 5.7. Barrier and site positions in the model (see the Appendix) were set equal to reduce the number of fitting parameters, and the site position (d2 = d1 = d3) was allowed to vary. The resulting fitted value of d1 was 0.3. Equally good fits could be obtained by fixing d2 to values between 0.2 and 0.9, allowing pKa(tet)2 to vary, yielding values between 5.1 and 5.9. The inset shows the hypothetical distribution of di- (—), mono-(···), and nonprotonated (– – –) tetramers for nondissociable (native) M2 protein based on a pKa(tet)1 of 6.4 and a pKa(tet)2 of 5.7. Current–voltage curves predicted for these pKa’s and for d1 = 0.3 at different external pH’s are shown in the Appendix.
Scheme 1
Scheme 1
Scheme 2
Scheme 2
Scheme 3
Scheme 3

Similar articles

Cited by

References

    1. Lamb RA, Holsinger LJ, Pinto LH. In: Receptor-Mediated Virus Entry into Cells. Wimmer E, editor. Cold Spring Harbor Laboratory Press; Cold Spring Harbor, NY: 1994. pp. 303–321.
    1. Sakaguchi T, Tu Q, Pinto LH, Lamb RA. Proc Natl Acad Sci USA. 1997;94:5000–5005. - PMC - PubMed
    1. Pinto LH, Dieckmann GR, Gandhi CS, Shaughnessy MA, Papworth CG, Braman J, Lear JD, Lamb RA, DeGrado WF. Proc Natl Acad Sci USA. 1997;94:11301–11306. - PMC - PubMed
    1. Duff KC, Kelly SM, Price NC, Bradshaw JP. FEBS Lett. 1992;311:256–258. - PubMed
    1. Duff KC, Gilchrist PJ, Saxena AM, Bradshaw JP. Virology. 1994;202:287–293. - PubMed

Publication types

MeSH terms