. 2000 Dec 19;97(26):14151-5.
doi: 10.1073/pnas.240326597.

Observation of the noncovalent assembly and disassembly pathways of the chaperone complex MtGimC by mass spectrometry

Affiliations

Observation of the noncovalent assembly and disassembly pathways of the chaperone complex MtGimC by mass spectrometry

M Fändrich et al. Proc Natl Acad Sci U S A. .

Abstract

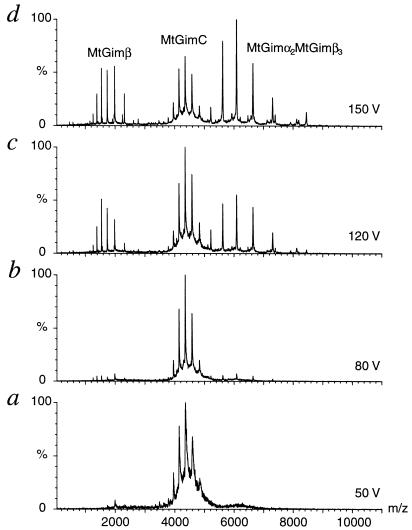
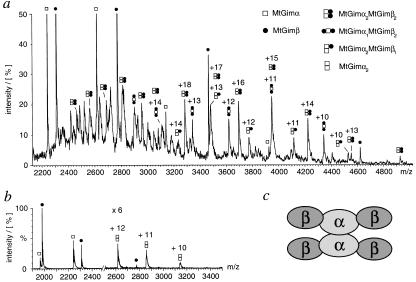
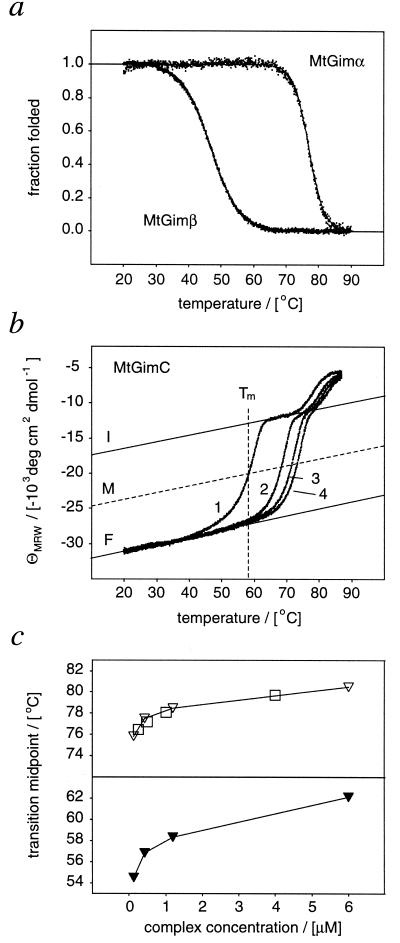
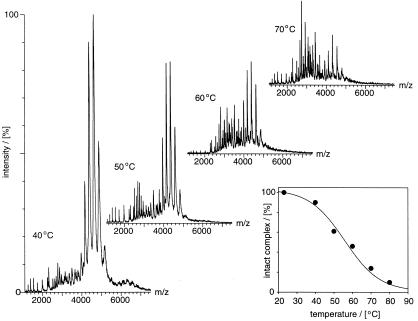
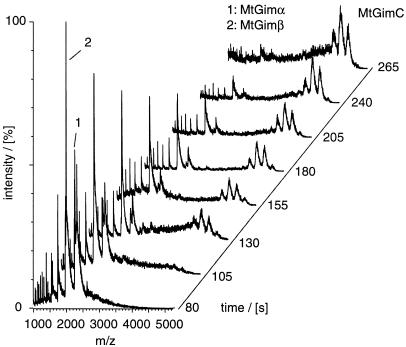
We have analyzed a newly described archaeal GimC/prefoldin homologue, termed MtGimC, by using nanoflow electrospray coupled with time-of-flight MS. The molecular weight of the complex from Methanobacterium thermoautotrophicum corresponds to a well-defined hexamer of two alpha subunits and four beta subunits. Dissociation of the complex within the gas phase reveals a quaternary arrangement of two central subunits, both alpha, and four peripheral beta subunits. By constructing a thermally controlled nanoflow device, we have monitored the thermal stability of the complex by MS. The results of these experiments demonstrate that a significant proportion of the MtGimC hexamer remains intact under low-salt conditions at elevated temperatures. This finding is supported by data from CD spectroscopy, which show that at physiological salt concentrations, the complex remains stable at temperatures above 65 degrees C. Mass spectrometric methods were developed to monitor in real time the assembly of the MtGimC hexamer from its component subunits. By using this methodology, the mass spectra recorded throughout the time course of the experiment showed the absence of any significantly populated intermediates, demonstrating that the assembly process is highly cooperative. Taken together, these data show that the complex is stable under the elevated temperatures that are appropriate for its hyperthermophile host and demonstrate that the assembly pathway leads exclusively to the hexamer, which is likely to be a structural unit in vivo.


Figures

Figure 1
Figure 1
Collision-induced dissociation of MtGimC from a solution at 15 μM concentration in 10 mM ammonium acetate at pH 8.0. a–d were recorded on the same sample by using cone voltages from 50 V to 150 V, as indicated. a shows the charge state series of the intact complex. Increasing the cone voltage as indicated in b–d leads to a disruption of the hexamer and the observation of a pentameric species MtGimα2MtGimβ3. Correspondingly, monomeric MtGimβ can be observed at m/z values below 3,000. In d, further dissociation products are present at very low intensity: monomeric MtGimα m/z 1,000–3,000 and oligomers of the constitution α1β4, α1β3, α2β2, and α1β2 m/z 5,000–8,000. Pressures of 8.7 × 10⁻⁶ and 7.1 × 10⁻⁸ Pa were used in the source and analyzer, respectively, and a capillary voltage of 1,650 V was applied.
Figure 2
Figure 2
Low molecular weight dissociation products of MtGimC. (a) Dissociation of MtGimC after a 1-in-25 dilution into water of the sample solution used to obtain the spectra in Fig. 1. Expansion of the region from 2,000 to 5,000 m/z demonstrates the presence of a tetramer, MtGimα2MtGimβ2, and two trimers, MtGimα2MtGimβ1 and MtGimα1MtGimβ2. The capillary and cone voltages were set to 1,750 V and 150 V, respectively, and pressures of 1.9 × 10⁻⁵ and 7.1 × 10⁻⁷ Pa were recorded in the source and analyzer. (b) MtGimα dimer is formed as a dissociation product of MtGimC under conditions that strongly destabilize the complex. The data were recorded on a 1-μM sample in 10 mM ammonium acetate, pH 8.0. Cone and capillary voltages of 100 V and 1,480 V, respectively, were applied, and an analyzer pressure of 7.8 × 10⁻⁸ Pa was used. (c) Proposed model of the MtGimC structure (5).
Figure 3
Figure 3
Thermal unfolding of MtGimα, MtGimβ, and MtGimC monitored by CD at 222 nm. (a) Thermal unfolding of isolated MtGimα and MtGimβ subunits displayed as the fractions folded and fitted to a two-state transition, as described previously (26). Subsequent cooling of the heated samples resulted in curves of identical shape and corresponded to similar Tm values (not shown). (b) Thermal unfolding of 1.2 μM MtGimC shown as the temperature dependence of the mean residue weight ellipticity (ΘMRW) at 222 nm. Changing the KCl concentration from 0 M (1), 0.2 M (2), 0.4 M (3), and 0.6 M (4) shifts the Tm values for the denaturation of MtGimC to higher temperatures. Whereas the high-temperature transition can be fitted with a two-state model, the transition midpoint of the distorted low-temperature transition was defined by approximating lines corresponding to the temperature dependences of ΘMRW of the folded complex (F) and the intermediate (I), as shown in the plot. The temperature at which the observed ΘMRW intersects a third line (M) representing the midpoint between F and I was used as the denaturation temperature. The distorted shape and Tm values did not change by using Tris- or ammonium acetate-based buffer systems or slower heating rates. The low-temperature transition is irreversible, as cooling produces a refolding curve characteristic of a cooperative process and, relative to the unfolding transition, a decreased Tm value (48.3 ± 1.5°C). (c) Concentration dependence of the transition midpoints of the MtGimC and MtGimα melting curves in the absence of salt. The Tm values of both the low- and high-temperature transition Tm values of MtGimC are concentration dependent (▾, low-temperature transition; ▿, high-temperature transition). The concentration dependence of the high-temperature transition corresponds to that of MtGimα, □.
Figure 4
Figure 4
Thermal dissociation of MtGimC by MS. Spectra of MtGimC were recorded at the temperatures indicated in the plot by using aliquots from the same solution with identical spectrometer settings. Peaks corresponding to intact MtGimC appear between 4,000 and 5,000 m/z and represent the most intense charge state series in the spectra recorded at low temperature. By raising the temperature, MtGimC dissociates in solution giving rise to various species including MtGimβ, the dominant series at m/z values below 2,000, and α2, β2, β3 between m/z 2,000 and 5,000. The latter two species were observed at temperatures above the Tm of MtGimβ and appear to represent aggregated species. For each spectrum, MtGimC (12 μM) was placed in the main body of a borosilicate glass capillary and incubated in a thermally controlled probe. The probe incorporates a thermoelectric device with a platinum resistive sensor and direct relay feedback control and is accurate to ±0.1°C (M.A.T., unpublished work). Each sample was equilibrated at the desired temperature for 15 min. After this time, a suitable back pressure was applied to drive the sample to the tip of the capillary and a voltage applied to commence the nanoflow electrospray process. The temperature within the nanoflow source and the countercurrent drying gas was maintained to be the same as the solution, achieved by a flow of nitrogen gas (140 l/h) through a thermally controlled manifold. Capillary and cone voltages were set to 1,400 V and 120 V, and a pressure of 2.35 × 10⁻⁸ Pa was recorded in the analyzer. Each spectrum in the figure represents the summation of 10 5-s acquisition steps. (Inset) The fraction of complex present was calculated from the sum of the intensity of the ions assigned to the complex relative to the total ion counts in each of the spectra. This value is expressed as the percentage of the ion intensity of the complex at 22°C, set to 100% on the basis of its population under ideal conditions, as shown in Fig. 1a.
Figure 5
Figure 5
Mass spectra recorded for a 2:1 mixture of MtGimβ/MtGimα at various time intervals after mixing the two subunits. Each trace represents the average of five 5-s acquisition steps and has been normalized according to the total ion count in each spectrum. The capillary voltage was set to 1,400 V with a cone voltage of 90 V. The analyzer pressure was recorded as 1.3 × 10⁻⁷ Pa. The experiment was repeated five times to confirm the reproducibility of the assembly process.

Comment in

  • Mass spectrometry of proteins of known mass.
    Miranker AD. Miranker AD. Proc Natl Acad Sci U S A. 2000 Dec 19;97(26):14025-7. doi: 10.1073/pnas.011526498. Proc Natl Acad Sci U S A. 2000. PMID: 11114170 Free PMC article. Review. No abstract available.

References

    1. Geissler S, Siegers K, Schiebel E. EMBO J. 1998;17:952–966. - PMC - PubMed
    1. Vainberg I E, Lewis S A, Rommelaere H, Ampe C, Vandekerckhove J, Klein H L, Cowan N J. Cell. 1998;93:863–873. - PubMed
    1. Siegers K, Waldmann T, Leroux M R, Grein K, Shevchenko A, Schiebel E, Hartl F U. EMBO J. 1999;18:75–84. - PMC - PubMed
    1. Hansen W J, Cowan N J, Welch W J. J Cell Biol. 1999;145:265–277. - PMC - PubMed
    1. Leroux M R, Fändrich M, Klunker D, Siegers K, Lupas A N, Brown J R, Schiebel E, Dobson C M, Hartl F U. EMBO J. 1999;18:6730–6743. - PMC - PubMed

Publication types

MeSH terms

LinkOut - more resources