

doi: 10.1073/pnas.240464097.
The zalpha domain of the editing enzyme dsRNA adenosine deaminase binds left-handed Z-RNA as well as Z-DNA
Affiliations
- PMID: 11087828
- PMCID: PMC17610
- DOI: 10.1073/pnas.240464097
Item in Clipboard
The zalpha domain of the editing enzyme dsRNA adenosine deaminase binds left-handed Z-RNA as well as Z-DNA
Proc Natl Acad Sci U S A.
.
Abstract
The Zalpha domain of human double-stranded RNA adenosine deaminase 1 binds specifically to left-handed Z-DNA and stabilizes the Z-conformation. Here we report spectroscopic and analytical results that demonstrate that Zalpha can also stabilize the left-handed Z-conformation in double-stranded RNA. Zalpha induces a slow transition from the right-handed A-conformation to the Z-form in duplex r(CG)(6), with an activation energy of 38 kcal mol(-1). We conclude that Z-RNA as well as Z-DNA can be accommodated in the tailored binding site of Zalpha. The specific binding of Z-RNA by Zalpha may be involved in targeting double-stranded RNA adenosine deaminase 1 for a role in hypermutation of RNA viruses.
Figures
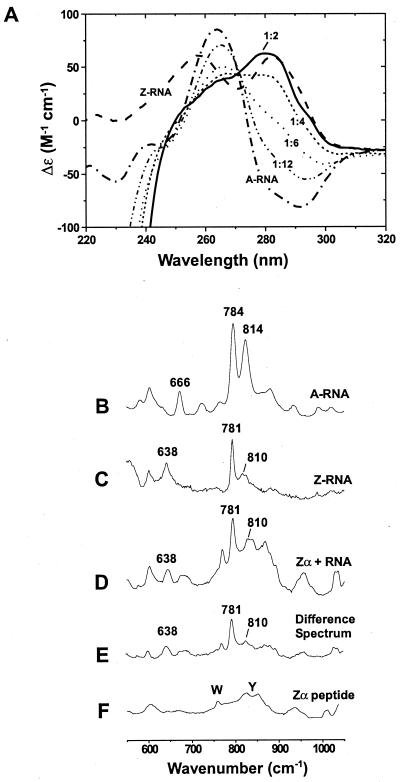
The Z-RNA conformation can be stabilized by Zα, as shown by CD
and Raman spectroscopy. CD studies: (A) Spectra are
shown for 5 μM duplex r(CG)6 in the A-form
(–⋅–⋅–). All samples contained 10 mM
Na2HPO4 (pH 7), 20 mM NaCl, and 0.5 mM EDTA. In
6.5 M NaClO4, the typical Z-RNA spectrum is seen (– –
–). The A-RNA spectrum changes as Zα is added (Zα has no CD signal
above 250 nm, but a strong negative ellipticity below 250 nm). Spectra
are shown for the addition of 5 μM Zα
(-⋅⋅-⋅⋅-), which is 1 Zα:12 bp; 10 μM Zα
(⋅ ⋅ ⋅ ⋅), 1:6; 15 μM Zα (- - - -), 1:4; and 30
μM Zα (——), 1:2. Inversion of the CD bands around 285 nm and the
decrease in signal at 266 nm are characteristic of the A → Z
transition. Raman spectroscopy: (B) The A-form of
r(CG)6 (5 mM duplex) has doublet peaks at 784 and 814
cm−1, which are characteristic of the A-conformation.
(C) Z-conformation of r(CG)6 (5 mM duplex)
induced by 6.5 M NaBr. The bands at 781 and 638 cm−1 and
markedly reduced intensity at 810 cm−1 distinguish the
Z-RNA conformation from the A-form (B).
(D) Zα⋅r(CG)6 complex containing 15
mM Zα and 5 mM r(CG)6 duplex (1 Zα:4 bp RNA). This
spectrum has several features identical to those of the salt-induced
Z-RNA spectrum (C), notably intensities at 638, 781, and
810 cm−1. (E) Difference spectrum created
by digitally subtracting the Zα spectrum (F) from that
of the Zα⋅RNA complex (D). (F)
Zα peptide spectrum (15 mM Zα). Raman bands for the aromatic amino
acids tryptophan and tyrosine are labeled.
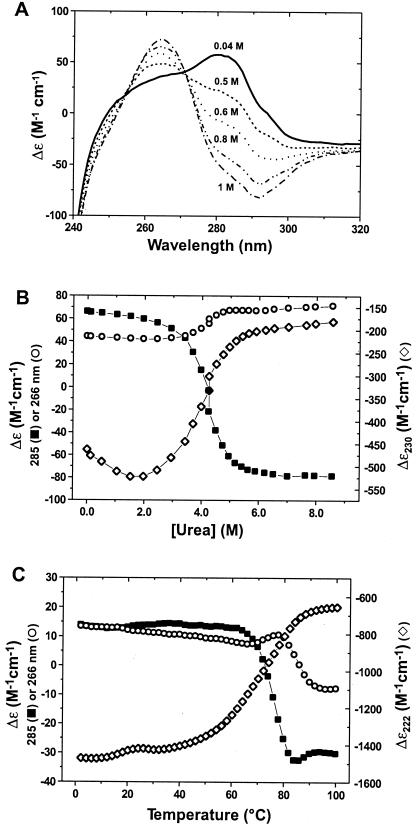
Perturbation of Zα⋅r(CG)6 complex results in
reversion of Z-RNA to the A-conformation, as seen in CD spectra.
(A) NaCl titration of Zα⋅r(CG)6
complex (30 μM Zα, 5 μM r(CG)6 duplex; 1 Zα:2 bp
RNA). As NaCl is added, the broad Z-RNA peak around 285 nm gradually
decreases, and then inverts, signifying reversion to the
A-conformation. Representative points shown are 0.04 M NaCl (——), 0.5
M (- - - -), 0.6 M (⋅ ⋅ ⋅ ⋅), 0.8 M
(–⋅⋅–⋅⋅–), and 1 M NaCl (–⋅–⋅–).
The midpoint of the titration is ca. 0.7 M NaCl.
(B) Urea denaturation of Zα⋅r(CG)6
complex. The urea titration was monitored at 285 (■), 266
(○), and 230 nm (⋄), corresponding to major ellipticity
signals of Z-RNA, A-RNA, and Zα protein, respectively. The relative
amount of Z-RNA decreases coincident with an increase in the A-RNA
signal, as Zα is denatured by increasing urea. (C)
Thermal denaturation of the Zα⋅r(CG)6 complex
monitored at 285 (■), 266 (○), and 222 nm (⋄),
corresponding to the major signal intensities for Z-RNA, A-RNA, and
Zα, respectively. As the temperature is increased, the relative
amount of Z-RNA decreases as Zα begins to denature
(ca. 60°C). In addition, as the Z-RNA signal
decreases, the A-RNA signal increases from 60°C up to approximately
80°C, above which the RNA denatures and the ellipticity drops at 266
nm, with a slight rise at 285 nm. Individual melting experiments
yielded Tm values of 69, 86, and 77°C for
Zα, r(CG)6, and Zα⋅r(CG)6,
respectively.
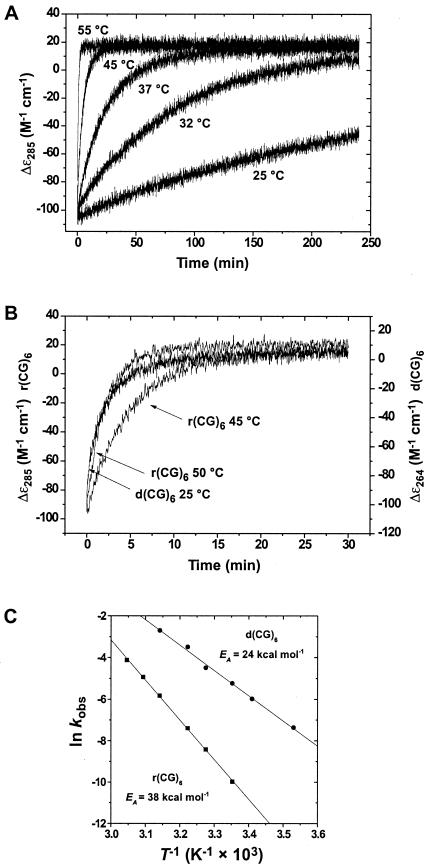
Temperature dependence of the A → Z-RNA transition.
(A) Kinetics of the A → Z transition as a function of
temperature. CD traces at 285 nm of the Zα-induced conformational
transitions are shown for 25, 32, 37, 45, and 55°C (the 50°C trace
was omitted for clarity). The kinetics for the A → Z transition are
first-order and were fit to single exponentials to obtain rate
constants (Table 1). (B) The rates of the A → Z
transition for the r(CG)6 duplex at 45 and 50°C (285 nm)
are comparable to the rate of B → Z transition of d(CG)6
(264 nm) at 25°C, demonstrating the higher-energy requirements of the
A → Z transition. (C) Temperature dependence for
Z-conformational transition of r(CG)6 (■) or
d(CG)6 (●). Arrhenius plots
constructed from rate data as a function of temperature yielded
activation energies of 38.1 ± 0.5 and 24.0 ± 0.8 kcal
mol−1 for r(CG)6 and d(CG)6,
respectively. Correlation coefficients for the Arrhenius plots of
r(CG)6 and d(CG)6 were 0.999 and 0.998,
respectively.
References
-
- Higuchi M, Single F N, Kohler M, Sommer B, Sprengel R, Seeburg P H. Cell. 1993;75:1361–1370. - PubMed
-
- Schwartz T, Lowenhaupt K, Kim Y G, Li L, Brown B A, II, Herbert A, Rich A. J Biol Chem. 1999;274:2899–2906. - PubMed
-
- Schade M, Behlke J, Lowenhaupt K, Herbert A, Rich A, Oschkinat H. FEBS Lett. 1999;458:27–31. - PubMed
Publication types
MeSH terms
Substances
LinkOut - more resources
Full Text Sources
Other Literature Sources
Research Materials
