. 2000 Dec 5;97(25):13484-7.
doi: 10.1073/pnas.250466497.

Transformations in methane hydrates

Affiliations

Transformations in methane hydrates

I M Chou et al. Proc Natl Acad Sci U S A. .

Abstract

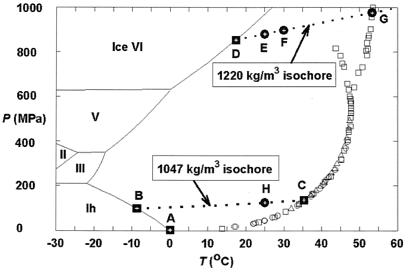
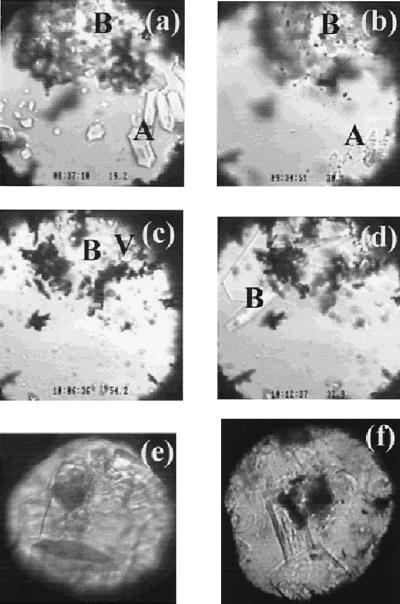
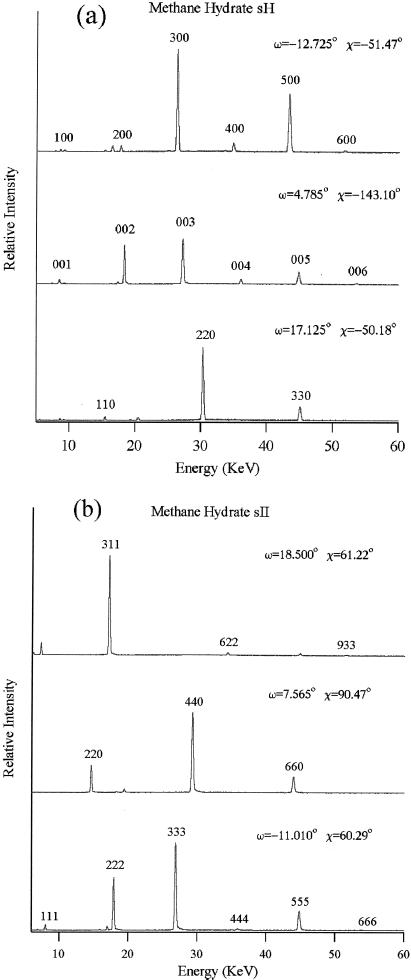
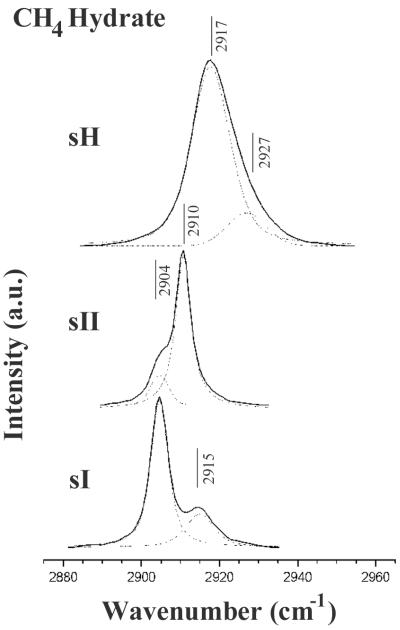
Detailed study of pure methane hydrate in a diamond cell with in situ optical, Raman, and x-ray microprobe techniques reveals two previously unknown structures, structure II and structure H, at high pressures. The structure II methane hydrate at 250 MPa has a cubic unit cell of a = 17.158(2) A and volume V = 5051.3(13) A(3); structure H at 600 MPa has a hexagonal unit cell of a = 11.980(2) A, c = 9.992(3) A, and V = 1241.9(5) A(3). The compositions of these two investigated phases are still not known. With the effects of pressure and the presence of other gases in the structure, the structure II phase is likely to dominate over the known structure I methane hydrate within deep hydrate-bearing sediments underlying continental margins.


Figures

Figure 1
Figure 1
Previous experimental results and the pressure–temperature (P–T) conditions for in situ observations in this study for the system CH4–H2O. The experimental data for the univariant P–T relations of the assemblage methane hydrate–water–methane vapor were taken from Marshall et al. (circles; ref. 10), Dyadin et al. (squares; ref. 11, ‖), and Nakano et al. (triangles; ref. 12). All symbols are for sI methane hydrate, except those squares branching out at higher P–T conditions. The boundaries for the stable ice phases and their melting curves (solid lines) are from ref. . Points A, B, C, and D (solid squares) indicate the P–T conditions for four invariant points, and they are for the following assemblages, respectively: sI methane hydrate–liquid water (Lw)–ice Ih–methane vapor (V), sI and sII methane hydrates–Lw–ice Ih, sI and sII methane hydrates–Lw–V, and sI and sH methane hydrates–Lw–ice VI. Points E, F, and G (dots) are P–T points along the isochore of pure water for 1,220 kg/m3 (14), and point H (dot) is a P–T point along the isochore of pure water for 1,047 kg/m3. The former isochore was defined by the melting P–T condition of ice VI at point D (16.6°C and 0.84 MPa; ref. 15), and the latter isochore by the melting P–T condition of ice Ih at point B (−8.7°C and 99 MPa; I-M.C., A.S., R.C.B., R.J.H., A.F.G., L.A.S., and S.H.K., unpublished observations). The latter isochore is also the univariant P–T conditions for the assemblage sI and sII methane hydrates–Lw (I-M.C., A.S., R.C.B., R.J.H., A.F.G., L.A.S., and S.H.K., unpublished observations).
Figure 2
Figure 2
(a–d) Images of a sample during a cooling, heating, and cooling cycle. (a) The coexistence of sI methane hydrate (A), sH methane hydrate (B), and water at 19.2°C and 880 MPa (near point D in Fig. 1). (b) The trace of sI methane hydrate at about 30°C and 900 MPa (point F in Fig. 1) immediately preceding full dissociation induced by heating. (c) The partial decomposition of the sH methane hydrate at 54°C and 980 MPa (point G in Fig. 1) and the formation of methane vapor (bubbles at the top-right corner indicated by V). (d) The growth of sH methane hydrate crystals during slow cooling at 33°C and 910 MPa (near point F in Fig. 1). (e) Images of single crystals of sH methane hydrate of a different sample at about 600 MPa and 25°C, taken after synchrotron x-ray diffraction analysis. The dark circular area is the spot damaged by the x-ray beam. The hexagonal dark area at lower part of the view is the base (001) face, and the hexagonal prism faces (100) are also clearly shown. (f) Images of single crystals of sII methane hydrate at about 250 MPa and 25°C, taken after synchrotron x-ray diffraction analysis. The dark circular area at the center of the view is the spot damaged by the x-ray beam. The cubic (100) face is clearly shown for the crystal at the lower part of the view. (The field of view in ad is about 0.3 mm and the sample chamber is about 0.25 mm thick. The field of view in e and f is about 0.2 mm, and the sample is about 0.15 mm thick.)
Figure 3
Figure 3
Representative single-crystal energy dispersive x-ray diffraction patterns of the investigated methane hydrate phases. (a) Three orthogonal orientations of the sH crystal at 600 MPa; 2θ = 8.027°, Ed = 88.569 keV⋅Å. (b) First three diffraction lines of the sII crystal at 250 MPa; 2θ = 8.004°, Ed = 88.828 keV⋅Å. Overtones are observed up to 90 keV, but are shown only to 60 keV. Weak peaks appearing at noninteger positions are fluorescence or escape peaks due to the intense reflections.
Figure 4
Figure 4
Comparison of the Raman spectrum of the CH4 ν1 band of sH methane hydrate at 25°C and 880 MPa (point E in Fig. 1) with the spectra of sI and sII methane hydrates at 25°C and 125 MPa (point H in Fig. 1). a.u., Arbitrary units. Also shown in dashed lines are the spectral deconvolutions of these Raman spectra.

References

    1. Holbrook W S, Hoskins H, Wood W T, Stephen R A, Lizarralde D. Science. 1996;273:1840–1843.
    1. Petrenko V F, Whitworth R W. Physics of Ice. Oxford: Clarendon; 1999.
    1. Chou I-M, Blank J G, Goncharov A F, Mao H-k, Hemley R J. Science. 1998;281:809–812. - PubMed
    1. Dyadin Y A, Bondaryuk I V, Zhurko F V. In: Inorganic and Physical Aspects of Inclusion, Inclusion Compounds. Atwood J L, Davies J E D, MacNicol D D, editors. Vol. 5. Oxford: Oxford Univ. Press; 1991. pp. 213–275.
    1. Jeffrey G A. In: Inclusion Compounds. Atwood J L, Davies J E D, MacNicol D D, editors. Vol. 1. London: Academic; 1984. pp. pp.135–190.

LinkOut - more resources