Protein folding and unfolding in microseconds to nanoseconds by experiment and simulation
- PMID: 11087839
- PMCID: PMC17607
- DOI: 10.1073/pnas.250473497
Protein folding and unfolding in microseconds to nanoseconds by experiment and simulation
Erratum in
- Proc Natl Acad Sci U S A 2001 Jan 16;98(2):777
Abstract
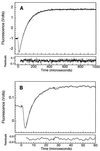
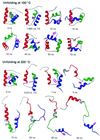
The Engrailed Homeodomain protein has the highest refolding and unfolding rate constants directly observed to date. Temperature jump relaxation measurements gave a refolding rate constant of 37,500 s(-1) in water at 25 degrees C, rising to 51,000 s(-1) around 42 degrees C. The unfolding rate constant was 1,100 s(-1) in water at 25 degrees C and 205,000 s(-1) at 63 degrees C. The unfolding half-life is extrapolated to be approximately 7.5 ns at 100 degrees C, which allows real-time molecular dynamics unfolding simulations to be tested on this system at a realistic temperature. Preliminary simulations did indeed conform to unfolding on this time scale. Further, similar transition states were observed in simulations at 100 degrees C and 225 degrees C, suggesting that high-temperature simulations provide results applicable to lower temperatures.
Figures


Similar articles
-
Microscopic reversibility of protein folding in molecular dynamics simulations of the engrailed homeodomain.Biochemistry. 2008 Jul 8;47(27):7079-89. doi: 10.1021/bi800118b. Epub 2008 Jun 14. Biochemistry. 2008. PMID: 18553935 Free PMC article.
-
Folding of horse cytochrome c in the reduced state.J Mol Biol. 2001 Oct 5;312(5):1135-60. doi: 10.1006/jmbi.2001.4993. J Mol Biol. 2001. PMID: 11580255
-
Microsecond folding of the cold shock protein measured by a pressure-jump technique.Biochemistry. 1999 Mar 9;38(10):2882-91. doi: 10.1021/bi982487i. Biochemistry. 1999. PMID: 10074340
-
Simulating the peptide folding kinetic related spectra based on the Markov State Model.Adv Exp Med Biol. 2014;805:199-220. doi: 10.1007/978-3-319-02970-2_9. Adv Exp Med Biol. 2014. PMID: 24446363 Review.
-
Ultrafast and downhill protein folding.Curr Opin Struct Biol. 2007 Feb;17(1):38-47. doi: 10.1016/j.sbi.2007.01.001. Epub 2007 Jan 12. Curr Opin Struct Biol. 2007. PMID: 17223539 Review.
Cited by
-
Improvement of structure-based potentials for protein folding by native and nonnative hydrogen bonds.Biophys J. 2011 Sep 21;101(6):1474-82. doi: 10.1016/j.bpj.2011.08.017. Epub 2011 Sep 20. Biophys J. 2011. PMID: 21943429 Free PMC article.
-
Stabilizing Effect of Inherent Knots on Proteins Revealed by Molecular Dynamics Simulations.Biophys J. 2018 Nov 6;115(9):1681-1689. doi: 10.1016/j.bpj.2018.09.015. Epub 2018 Sep 22. Biophys J. 2018. PMID: 30314655 Free PMC article.
-
Electrostatic All-Passive Force Clamping of Charged Nanoparticles.ACS Nano. 2025 Mar 18;19(10):10173-10179. doi: 10.1021/acsnano.4c17299. Epub 2025 Mar 4. ACS Nano. 2025. PMID: 40036500 Free PMC article.
-
Probing the folding intermediate of Bacillus subtilis RNase P protein by nuclear magnetic resonance.Biochemistry. 2010 Nov 9;49(44):9428-37. doi: 10.1021/bi100287y. Biochemistry. 2010. PMID: 20843005 Free PMC article.
-
On the Configurational and Conformational Changes in Photoactive Yellow Protein that Leads to Signal Generation in Ectothiorhodospira halophila.J Biol Phys. 2002 Sep;28(3):395-412. doi: 10.1023/A:1020360505111. J Biol Phys. 2002. PMID: 23345784 Free PMC article.
References
-
- Chamberlain A K, Marqusee S. Adv Protein Chem. 2000;53:283–328. - PubMed
-
- Fersht A R. Structure and Mechanism in Protein Science. New York: Freeman; 1998.
-
- Jackson S E, Fersht A R. Biochemistry. 1991;30:10428–10435. - PubMed
-
- Schindler T, Herrler M, Marahiel M A, Schmid F X. Nat Struct Biol. 1995;2:663–673. - PubMed
Publication types
MeSH terms
Substances
Grants and funding
LinkOut - more resources
Full Text Sources
Molecular Biology Databases
Miscellaneous

