. 2000 Nov 21;97(24):13126-31.
doi: 10.1073/pnas.97.24.13126.

Calcium-dependent enzyme activation and vacuole formation in the apical granular region of pancreatic acinar cells

Affiliations

Calcium-dependent enzyme activation and vacuole formation in the apical granular region of pancreatic acinar cells

M Raraty et al. Proc Natl Acad Sci U S A. .

Abstract

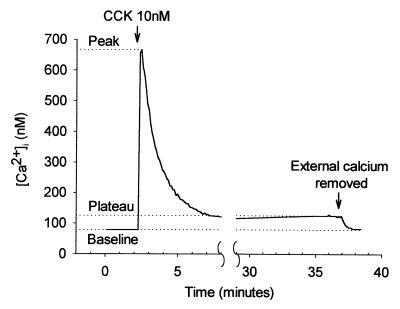
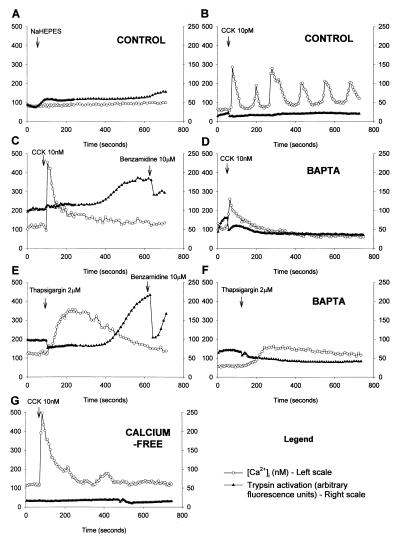
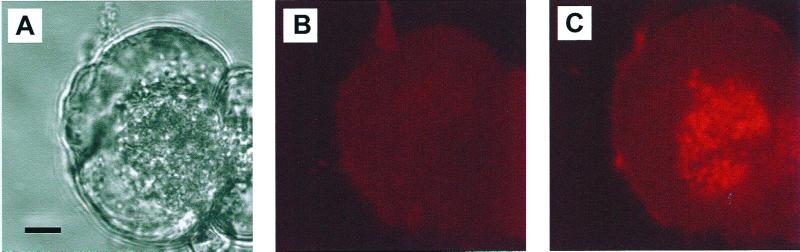
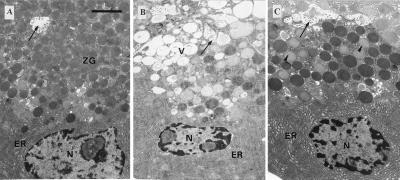
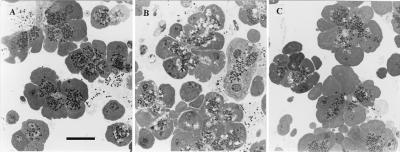
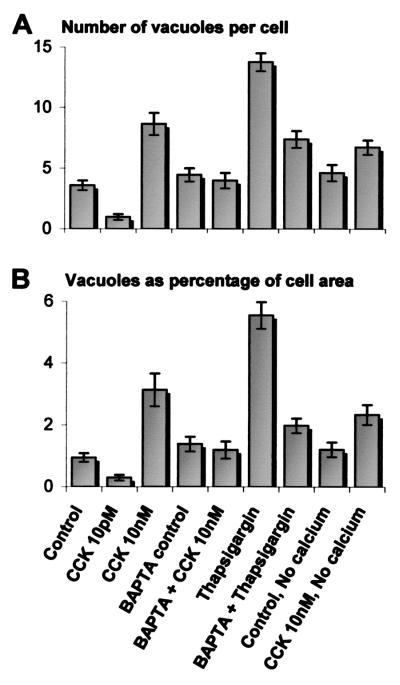
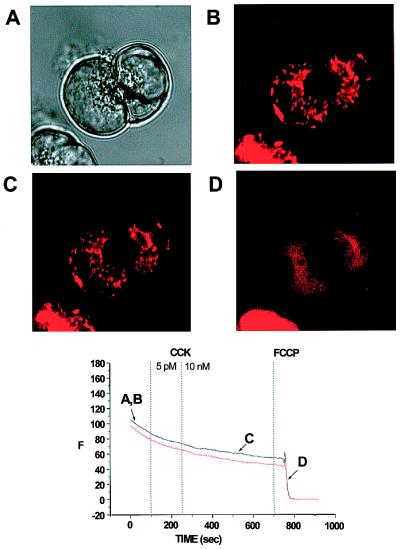
The pancreatic acinar cell produces powerful digestive enzymes packaged in zymogen granules in the apical pole. Ca(2+) signals elicited by acetylcholine or cholecystokinin (CCK) initiate enzyme secretion by exocytosis through the apical membrane. Intracellular enzyme activation is normally kept to a minimum, but in the often-fatal human disease acute pancreatitis, autodigestion occurs. How the enzymes become inappropriately activated is unknown. We monitored the cytosolic Ca(2+) concentration ([Ca(2+)](i)), intracellular trypsin activation, and its localization in isolated living cells with specific fluorescent probes and studied intracellular vacuole formation by electron microscopy as well as quantitative image analysis (light microscopy). A physiological CCK level (10 pM) eliciting regular Ca(2+) spiking did not evoke intracellular trypsin activation or vacuole formation. However, stimulation with 10 nM CCK, evoking a sustained rise in [Ca(2+)](i), induced pronounced trypsin activation and extensive vacuole formation, both localized in the apical pole. Both processes were abolished by preventing abnormal [Ca(2+)](i) elevation, either by preincubation with the specific Ca(2+) chelator 1, 2-bis(O-aminophenoxy)ethane-N,N-N',N'-tetraacetic acid (BAPTA) or by removal of external Ca(2+). CCK hyperstimulation evokes intracellular trypsin activation and vacuole formation in the apical granular pole. Both of these processes are mediated by an abnormal sustained rise in [Ca(2+)](i).


Figures

Figure 1
Figure 1
[Ca2+]i response to hyperstimulation with CCK, showing the typical large initial rise followed by a prolonged plateau phase. Removal of external Ca2+ during the plateau phase results in a drop in [Ca2+]i back to baseline levels indicating that plasma membrane Ca2+ channels remain open throughout the stimulation period. The measurements used to quantify changes in [Ca2+]i as described in the text are indicated.
Figure 2
Figure 2
Simultaneous measurement of [Ca2+]i response with fura-2 (○) (nM, plotted on left scale) and trypsin activity with BZiPAR (▴) (arbitrary fluorescence units, plotted on right scale). (A) Nonstimulated control. Little change in either [Ca2+]i or BZiPAR fluorescence. (B) Stimulation with 10 pM CCK elicits typical [Ca2+]i oscillations without trypsin activation. (C) Stimulation with 10 nM CCK evokes an immediate elevation of [Ca2+]i followed by a prolonged plateau phase. After a delay of approximately 300 seconds, there is a rise in trypsin activity to an elevated plateau level. Addition of 10 μM benzamidine, a cell-permeable trypsin inhibitor, reduces activity. (D) Stimulation with 10 nM CCK after pretreatment with BAPTA produces an attenuated [Ca2+]i response and no trypsin activation. (E) Thapsigargin (2 μM) evokes a broad [Ca2+]i response, and there is marked enzyme activation after 300 seconds, which is subsequently reduced by 10 μM benzamidine. (F) After BAPTA preloading, thapsigargin elicits very little change in [Ca2+]i and there is no sign of trypsin activity. (G) In the absence of external Ca2+, 10 nM CCK evokes a normal transient [Ca2+]i rise but no plateau phase and also no enzyme activation.
Figure 3
Figure 3
CCK (10 nM) evokes trypsin activation specifically in the apical granular area. (A) Transmitted light image showing the ZGs clustered at the secretory pole in the right part of the cell. (Bar = 5 μm.) (B) Fluorescence image taken just before the application of CCK. (C) Fluorescence image taken 15 min after start of stimulation with 10 nM CCK, demonstrating trypsin activity concentrated in the granular portion of the cell. There is virtually no fluorescence from tryptic cleavage of BZiPAR in the rest of the cell.
Figure 4
Figure 4
Ultrastructure of pancreatic acinar cells. (Bar = 2 μm.) (A) Normal acinar cell after loading with fura-2 showing ZGs concentrated in the apical pole of the cell, close to the acinar lumen (arrow), into which microvilli project. The basal region of the cell contains nucleus (N) surrounded by cisternae of ER. (B) Acinar cell after stimulation with 10 nM CCK for 60 minutes. Vacuoles (V) have accumulated in the apical cytoplasm. N, nucleus; arrow, acinar lumen. (C) Acinar cell loaded with BAPTA and stimulated with 10 nM CCK for 60 min. There is little evidence of vacuolization. Some decondensation of ZGs (arrowheads) has occurred.
Figure 5
Figure 5
Examples of toluidine blue-stained sections of acinar cells viewed under light microscope, used for quantification of vacuolization. Darkly stained ZGs are seen in the apical areas, against the pale cytoplasm. Vacuoles appear as unstained “holes” within the cytoplasm. Nuclei are seen in some sections. (Bar = 20 μm.) (A) Unstimulated control cells. ZGs are plentiful and few vacuoles are visible. (B) Cells incubated with 10 nM CCK for 60 minutes in Ca2+-containing medium. Abnormal vacuoles are clearly seen. (C) BAPTA-loaded cells stimulated with 10 nM CCK for 60 minutes. The cellular appearance is almost indistinguishable from the control cells. Vacuolization is blocked.
Figure 6
Figure 6
Degree of cytoplasmic vacuole formation in each experimental group, expressed as (A) number of vacuoles per cell and (B) area of vacuoles as a percentage of cell sectional area. Each column represents the mean value, and the bars show standard error.
Figure 7
Figure 7
Distribution of mitochondria-specific TMRE fluorescence in living acinar cells and effect of CCK on the mitochondrial membrane potential. (A) Transmitted light image of two acinar cells showing granules concentrated at the secretory pole. (B) The active mitochondria are shown by TMRE fluorescence as a ring surrounding the granular region. (C) After prolonged hyperstimulation with CCK (10 nM), there is no change in the configuration of the mitochondria or in their membrane potential, as shown by persistence of TMRE fluorescence. (D) After application of the protonophore carbonylcyanide p-trifluoro-methoxyphenylhydrazone (5 μM), the mitochondrial membrane potential collapses, and the TMRE fluorescence is dispersed. Below the four images is shown a graph illustrating TMRE fluorescence intensity throughout the experiment in the two cells studied.

Comment in

References

    1. Palade G E. Science. 1975;189:347–358. - PubMed
    1. Case R M, Argent B E. In: Handbook of Physiology. Schultz S G, editor. Washington, DC: Am. Physiol. Soc.; 1989. pp. 383–417.
    1. Gorelick F S, Jamieson J D. In: Physiology of the Gastrointestinal Tract. 3rd Ed. Johnson L R, Alpers D H, Jacobson E D, Christensen J, Walsh J H, editors. New York: Raven; 1994. pp. 1353–1376.
    1. Neoptolemos J P. In: Acute Pancreatitis, in Bailliere's Clinical Gastroenterology. Neoptolemos J P, editor. Vol. 13. London: Bailliere Tindall; 1999.
    1. Kasai H. Trends Neurosci. 1999;22:88–93. - PubMed

Publication types

MeSH terms

LinkOut - more resources