. 2000 Nov 21;97(24):13384-9.
doi: 10.1073/pnas.97.24.13384.

Requirement for the lpA1 lysophosphatidic acid receptor gene in normal suckling behavior

Affiliations

Requirement for the lpA1 lysophosphatidic acid receptor gene in normal suckling behavior

J J Contos et al. Proc Natl Acad Sci U S A. .

Abstract

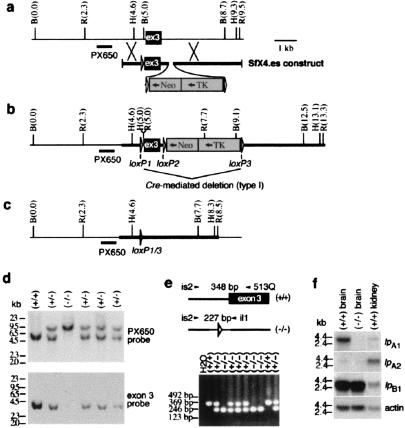
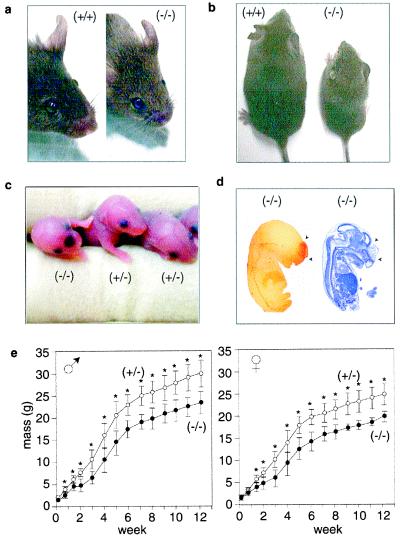
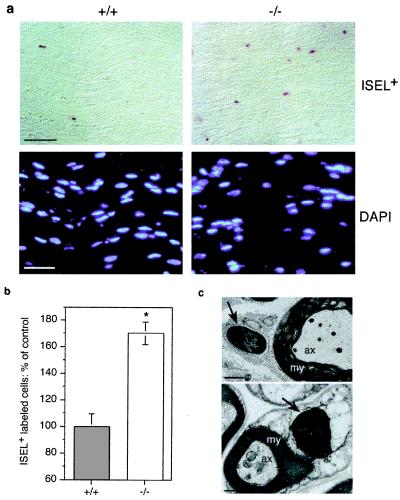
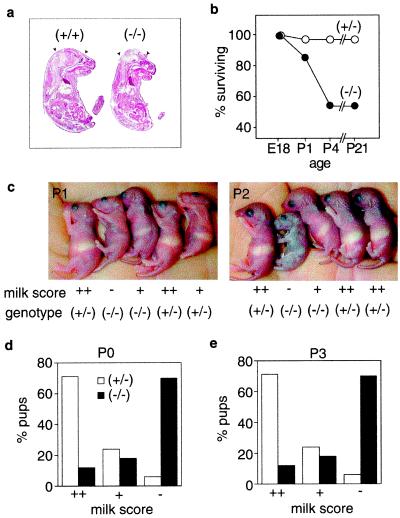
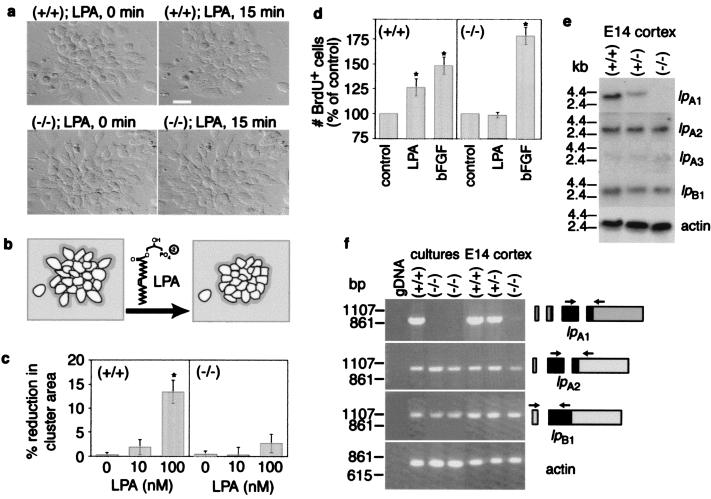
Although extracellular application of lysophosphatidic acid (LPA) has been extensively documented to produce a variety of cellular responses through a family of specific G protein-coupled receptors, the in vivo organismal role of LPA signaling remains largely unknown. The first identified LPA receptor gene, lp(A1)/vzg-1/edg-2, was previously shown to have remarkably enriched embryonic expression in the cerebral cortex and dorsal olfactory bulb and postnatal expression in myelinating glia including Schwann cells. Here, we show that targeted deletion of lp(A1) results in approximately 50% neonatal lethality, impaired suckling in neonatal pups, and loss of LPA responsivity in embryonic cerebral cortical neuroblasts with survivors showing reduced size, craniofacial dysmorphism, and increased apoptosis in sciatic nerve Schwann cells. The suckling defect was responsible for the death among lp(A1)((-/-)) neonates and the stunted growth of survivors. Impaired suckling behavior was attributable to defective olfaction, which is likely related to developmental abnormalities in olfactory bulb and/or cerebral cortex. Our results provide evidence that endogenous lysophospholipid signaling requires an lp receptor gene and indicate that LPA signaling through the LP(A1) receptor is required for normal development of an inborn, neonatal behavior.


Figures

Figure 1
Figure 1
Targeted disruption of lpA1 by homologous recombination. (a) Map of the wild-type lpA1 locus including exon 3 (ex3, black box), the targeting construct, and location of probe (PX650) used for Southern blot. B, BglII; R, EcoRI; H, HindIII. (b) Map of the initial homologously recombined locus. (c) Map of the homologously recombined locus after transient expression of Cre recombinase in an embryonic stem cell clone has deleted all DNA between loxP1 and loxP3 sites. (d) Southern blot analysis of BglII-digested genomic DNA (10 μg per lane) from mice generated by crossing heterozygotes. After initial hybridization with PX650, the same blot was stripped and rehybridized with an exon 3 probe. (e) PCR assay containing three primers (vzg.is2, 513Q, and vzg.il1) detecting inheritance of wild-type lpA1 (348 bp) and deletion mutation (227 bp). (f) Northern blot (20 μg per lane) of RNA from adult brain probed with the indicated gene (wild-type kidney shown as positive control for lpA2 and lpB1; only an exon 3 probe was used for lpA1).
Figure 2
Figure 2
Gross abnormalities in lpA1(−/−) mice. (a) Craniofacial deformity in adult lpA1(−/−) mice. Note the blunted snout and more widely spaced eyes. (b) Overall size decrease in lpA1(−/−) mice. Two 9-week-old male siblings are shown. (c) Frontal cranial hemorrhage in a newborn lpA1(−/−) pup but not in littermates. (d) Sagittal sections of an E13 lpA1(−/−) embryo with frontal cranial hemorrhage (the earliest time point this phenotype was observed). Sections shown were stained to identify erythrocytes (left) using peroxidase (pseudocolored red) or Nissl substance (right) using cresyl violet. (e) Total body mass measurements for lpA1(−/−) mice (●) and control lpA1(+/−) littermates (○) from lpA1(+/−) X lpA1(+/−) crosses. Data points are means ± SD; *, P < 0.05 (repeated measures were analyzed with ANOVA). Mass measurements of lpA1(+/+) littermates overlapped those shown for lpA1(+/−) and are not presented for clarity.
Figure 3
Figure 3
Increased apoptosis and decreased Schwann cell numbers in lpA1(−/−) sciatic nerves. (a) Sections of young adult lpA1(−/−) sciatic nerves were stained for fragmented DNA (using ISEL+) or nuclei (using DAPI). (b) Quantified apoptosis increases in lpA1(−/−) sciatic nerves. Bars are means ± SEM from four animals of each genotype; *, P < 0.005 (unpaired t test). (c) Electron microscopic confirmation of Schwann cell apoptosis in lpA1(−/−) sciatic nerves. Note black nuclei indicating chromatin condensation (arrows). ax, axon; my, myelin sheath. [Bars = 40 μm (a), 1 μm (c, top), 0.6 μm (c, bottom).]
Figure 4
Figure 4
Neonatal deaths and impaired suckling in lpA1(−/−) mice. (a) Sagittal sections of an E18 exencephalic lpA1(−/−) embryo and control littermate stained with hematoxylin/eosin. Note disorganized brain structure and lack of skull (arrowheads). (b) Survival plot for lpA1(−/−) mice and control lpA1(+/−) littermates from late embryonic ages through weaning (n = 38 for lpA1(−/−) pups; n = 37 for lpA1(+/−) pups). (c) Observed lack of milk in stomachs of dead and/or dying lpA1(−/−) pups. Relative milk quantities in bellies were scored either as full/near full (++), intermediate (+), or empty/near empty (−). Note dead lpA1(−/−) pup at P2. (d) Pup milk scores at P0 (8–20 h after birth) or (e) P3 correlated with genotype (n = 34–38 for lpA1(−/−) pups; n = 37 for lpA1(+/−) pups).
Figure 5
Figure 5
Lack of normal LPA responsiveness in lpA1(−/−) cortical neuroblast cultures and expression of additional LPA receptor gene transcripts. (a) Time-lapse differential interference contrast images of cortical neuroblasts treated for 15 min with 100 nM LPA. (Bar = 20 μm) (b) Schematic diagram of observed cluster compaction in response to LPA and measured areas (inside dark outline of cluster). (c) Quantified relative changes in neuroblast cluster culture areas. Data show mean ± SEM; n >15 embryos of each genotype. *, P < 0.05 (ANOVA with Fisher's post hoc test). (d) Effects of 18-h LPA (100 nM) or bFGF (20 ng/ml) treatment on neuroblast proliferation as measured by BrdUrd incorporation. Data show mean ± SEM; n >12 embryos of each genotype. *, P < 0.05 (ANOVA with Fisher's post hoc test). (e) Northern blot detection of lpA1, lpA2, lpA3, and lpB1 in E14 cortex. (f) RT-PCR detection of lpA1, lpA2, and lpB1 in cortical cultures and E14 brains. Relative locations of primers in each gene are indicated to the right (boxes indicate exons; black areas indicate coding region). lpA3 was not readily detectable in the cultures by RT-PCR. Linear range β-actin RT-PCR amplification products are shown as a control for template cDNA quantities.

Similar articles

Cited by

References

    1. van Corven E J, Groenink A, Jalink K, Eichholtz T, Moolenaar W H. Cell. 1989;59:45–54. - PubMed
    1. Ridley A J, Hall A. Cell. 1992;70:389–399. - PubMed
    1. Eichholtz T, Jalink K, Fahrenfort I, Moolenaar W H. Biochem J. 1993;291:677–680. - PMC - PubMed
    1. Yatomi Y, Igarashi Y, Yang L, Hisano N, Qi R, Asazuma N, Satoh K, Ozaki Y, Kume S. J Biochem (Tokyo) 1997;121:969–973. - PubMed
    1. Moolenaar W H, Kranenburg O, Postma F R, Zondag G C. Curr Opin Cell Biol. 1997;9:168–173. - PubMed

Publication types

MeSH terms

Substances