

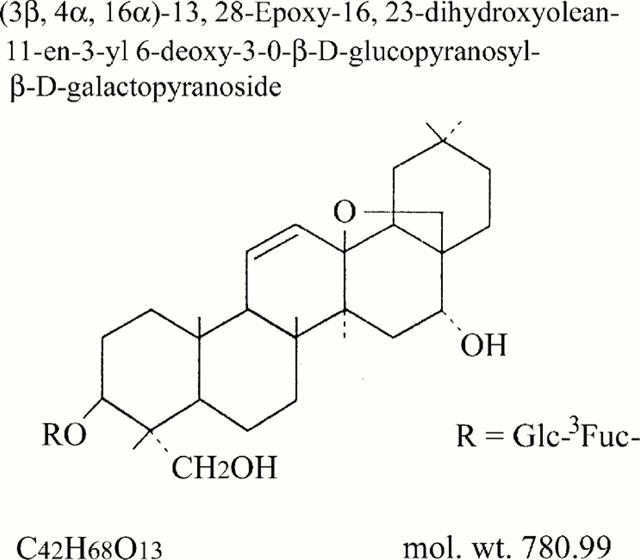
Effect of saikosaponin, a triterpene saponin, on apoptosis in lymphocytes: association with c-myc, p53, and bcl-2 mRNA
- PMID: 11090099
- PMCID: PMC1572450
- DOI: 10.1038/sj.bjp.0703559
Effect of saikosaponin, a triterpene saponin, on apoptosis in lymphocytes: association with c-myc, p53, and bcl-2 mRNA
Abstract
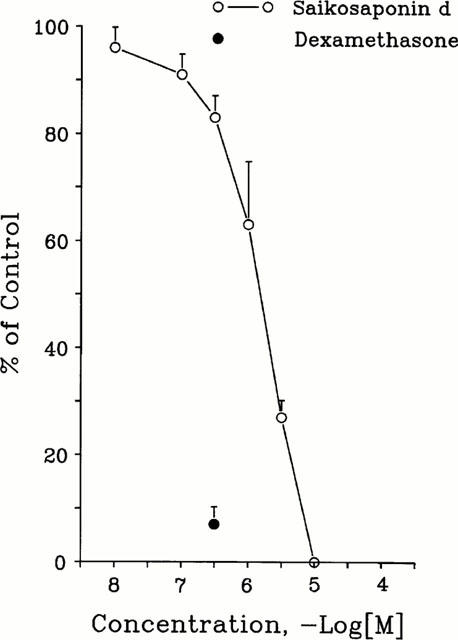
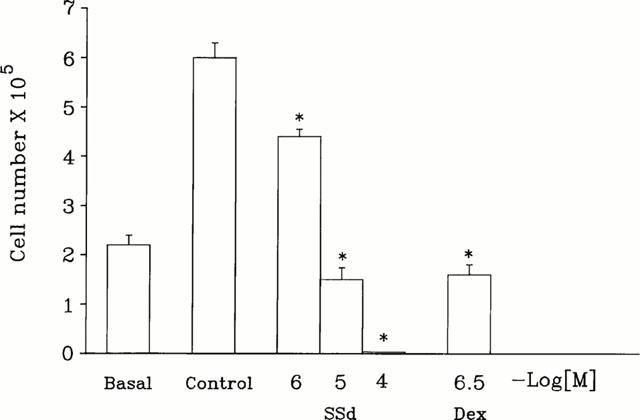
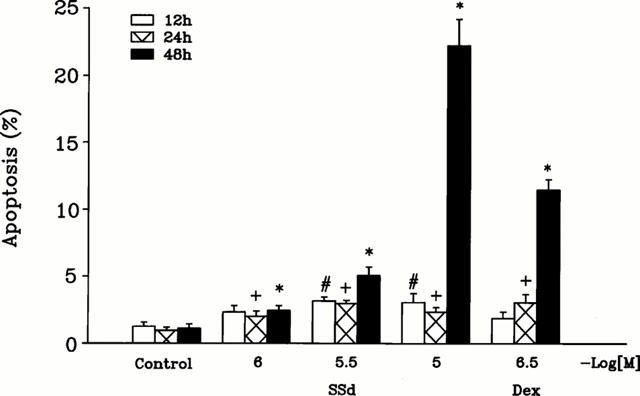
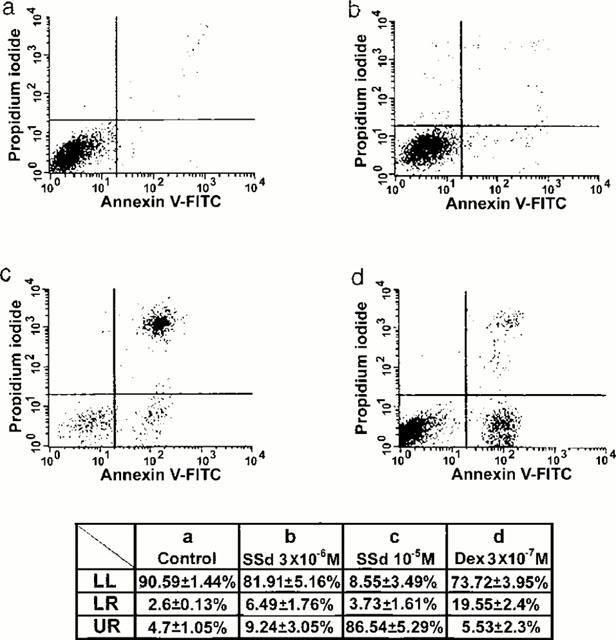
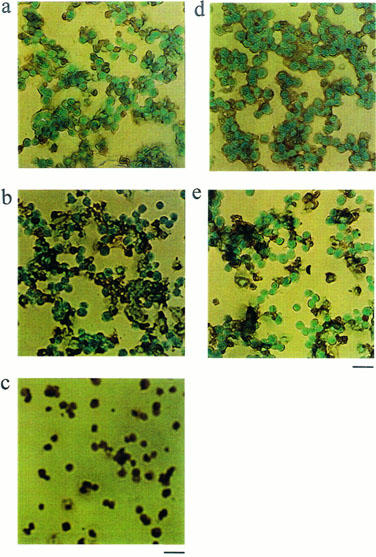
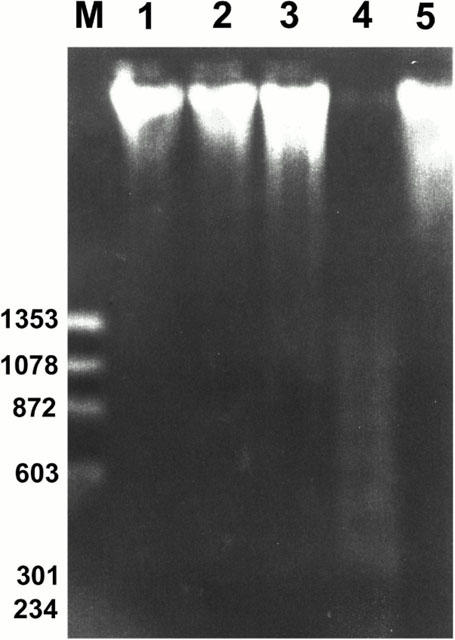
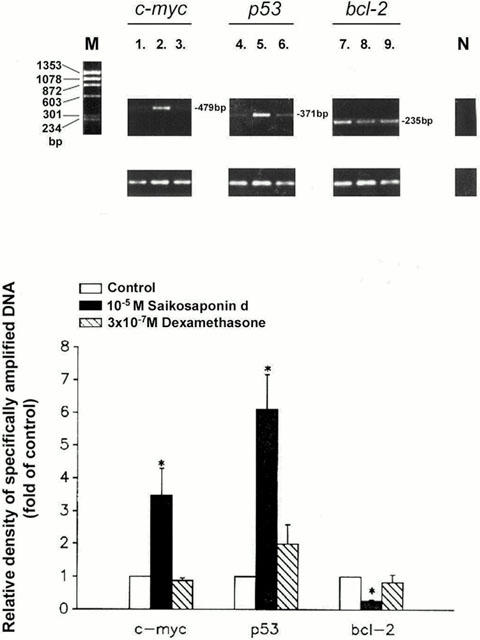
1. The mechanisms involved in the apoptotic effect of saikosaponin-d, a triterpene saponin from Bupleurum falcatum L., were studied in human CEM lymphocytes and compared with those of dexamethasone (3 x 10(-7) M). 2. Saikosaponin-d (10(-8) to 10(-5) M) inhibited the serum-stimulated [(3)H]-thymidine incorporation in a concentration-dependent manner. Dexamethasone also inhibited serum-stimulated [(3)H]-thymidine incorporation. 3. Cell viability was unaffected by saikosaponin-d until 10(-5) - 10(-4) M. Dexamethasone significantly reduced the number of viable cells. 4. Following saikosaponin-d (10(-5) - 10(-4) M) treatment, flow cytometry analysis of propidium iodide-stained cells showed a significant increase in the percentage of cells in the apoptotic region. Dexamethasone also significantly increased the percentage of apoptotic cells. The supravital exposure to propidium iodide and annexin V labelling demonstrated that saikosaponin-d (10(-5) - 10(-4) M) induced apoptosis as well as necrosis. 5. The apoptotic effect of saikosaponin-d (3 x 10(-6) - 10(-4) M) was also demonstrated by TUNEL analysis and DNA laddering. The percentage of apoptotic cells induced by saikosaponin-d (3 x 10(-6) - 10(-5) M) was unaffected by the presence of Z-VAD-FMK, indicating that saikosaponin-d-induced apoptosis may not be mediated by caspase activity. However, the percentage of apoptotic cells induced by dexamethasone was significantly reduced by the presence of Z-VAD-FMK. 6. Levels of c-myc, p53, and bcl-2 mRNA were analysed by the reverse transcription-polymerase chain reaction. Levels of c-myc and p53 mRNA were significantly increased, while the level of bcl-2 mRNA was decreased, by saikosaponin-d (10(-5) M) treatment. Dexamethasone did not significantly change the expression of these genes. 7. It is suggested that the apoptotic effect of saikosaponin-d may be partly mediated by increases in c-myc and p53 mRNA levels accompanied by a decrease in bcl-2 mRNA level.
Figures
References
-
- ALNEMRI E.S. Mammalian cell death proteases: a family of highly conserved aspartate specific cysteine proteases. J. Cell. Biochem. 1997;64:33–42. - PubMed
-
- BOERSMA A.W.M., NOOTER K., OOSTRUM R.G., STOTER G. Quantification of apoptotic cells with fluorescein isothiocyanate-labeled Annexin V in Chinese hamster ovary cell cultures treated with cisplatin. Cytometry. 1996;24:123–130. - PubMed
-
- BRUNETTI M., MARTELLI N., COLASANTE A., PIANTELLIi M., MUSIANI P., AIELLO F.B. Spontaneous and glucocorticoid-induced apoptosis in human mature T lymphocytes. Blood. 1995;86:4199–4205. - PubMed
-
- CHOMCZYNSKI P., SACCHI N. Single-step method of RNA isolation by acid guanidium thiocyanate-phenol chloroform extraction. Anal. Biochem. 1987;162:156–159. - PubMed
Publication types
MeSH terms
Substances
LinkOut - more resources
Full Text Sources
Research Materials
Miscellaneous
