Comparative Study
. 2000 Nov 15;14(22):2855-68.
doi: 10.1101/gad.842600.

Nuclear organization of DNA replication in primary mammalian cells

Affiliations
Comparative Study

Nuclear organization of DNA replication in primary mammalian cells

B K Kennedy et al. Genes Dev. .

Abstract

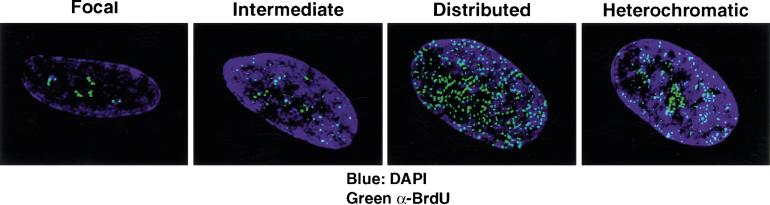
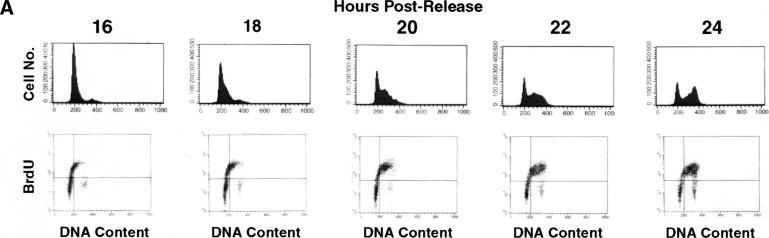
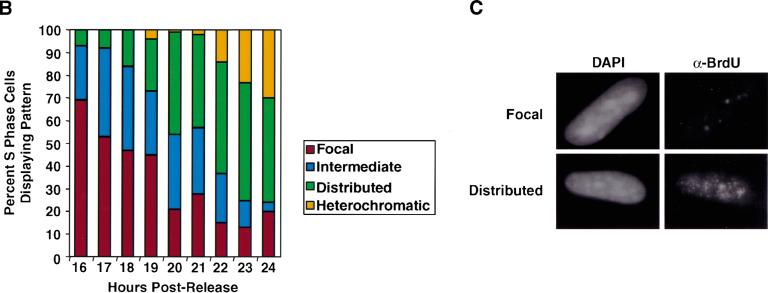
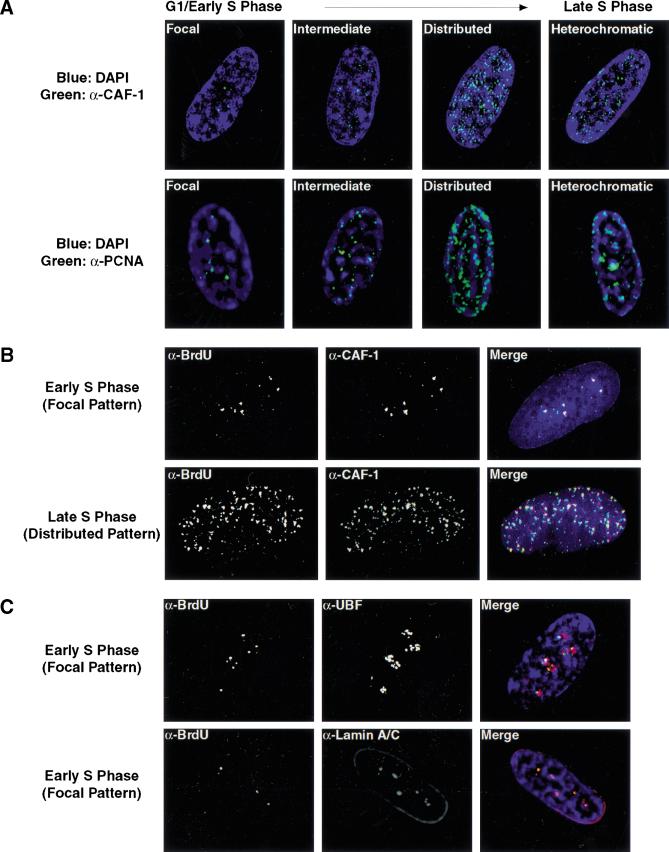
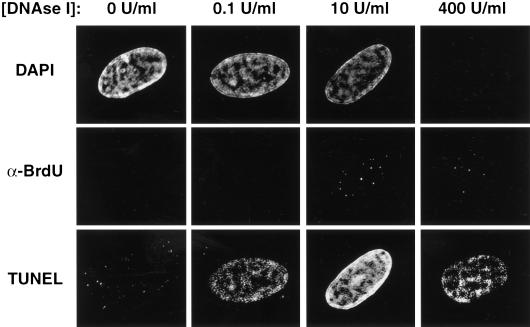
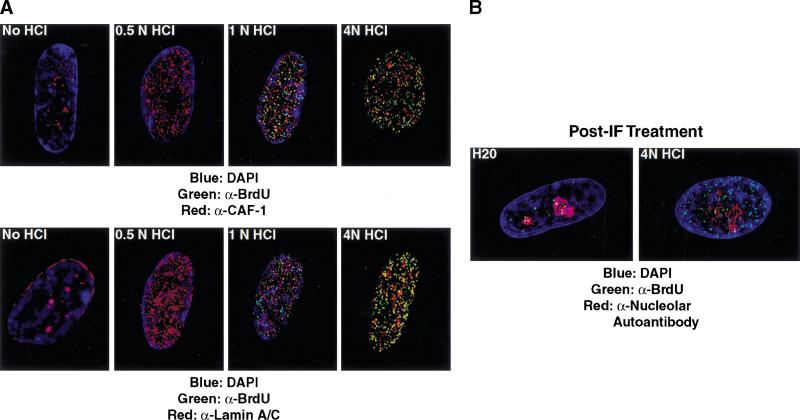
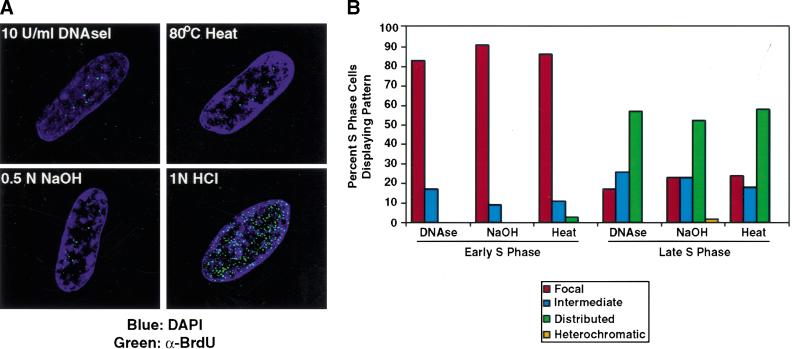
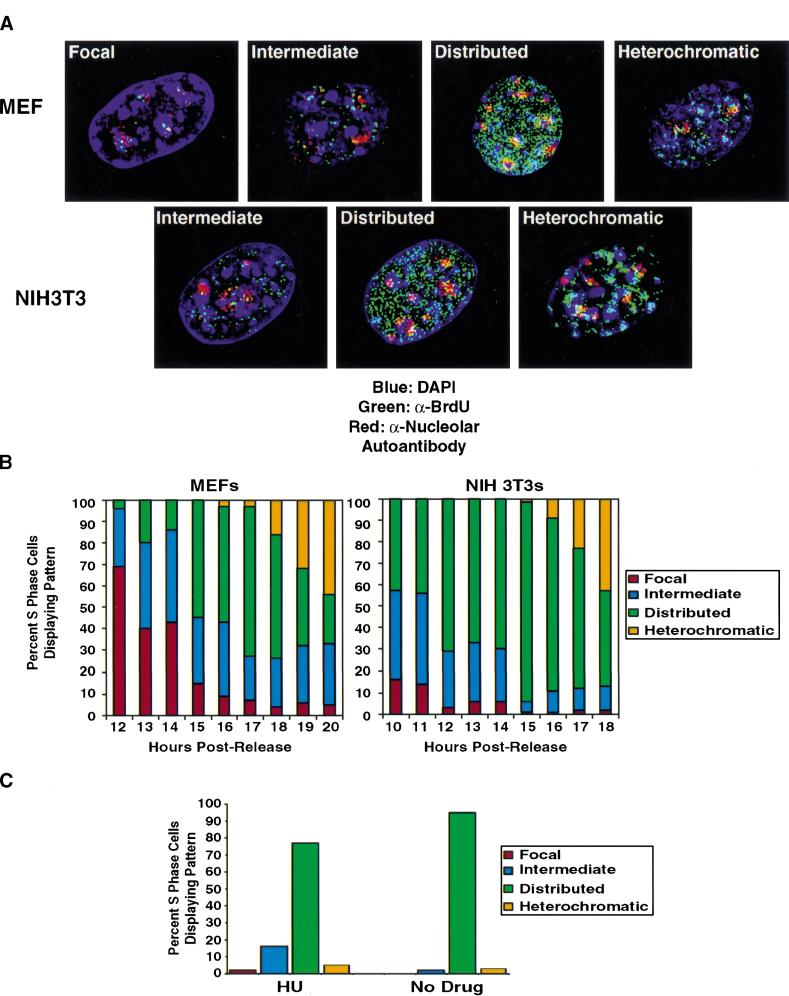
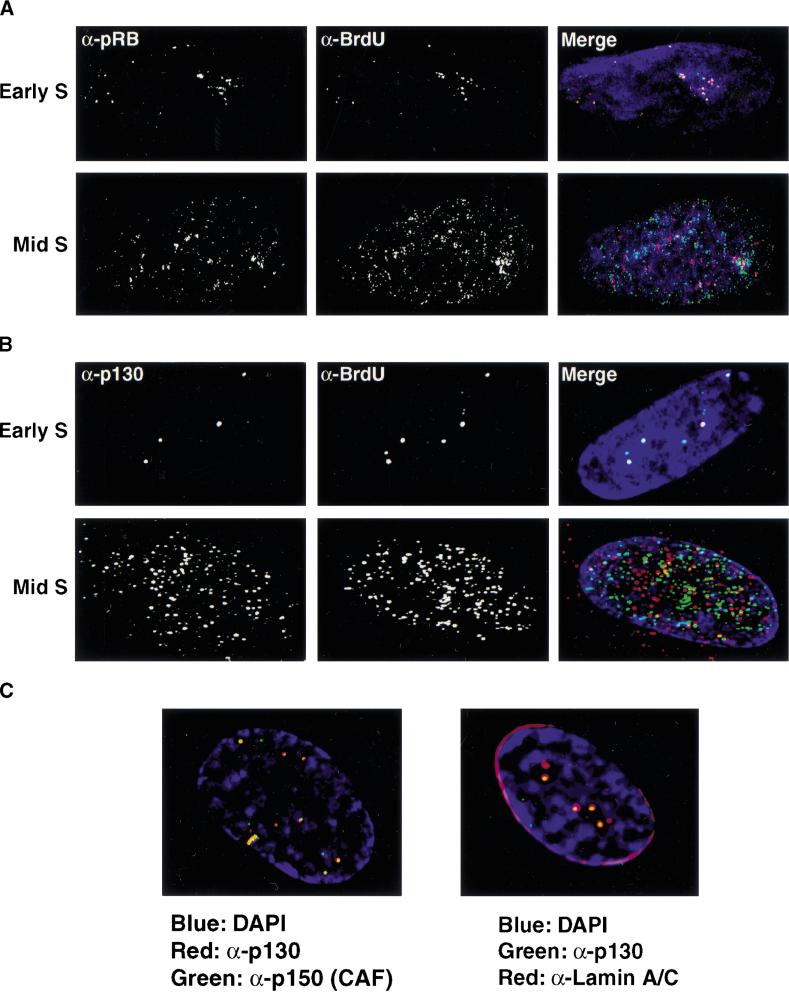
Using methods that conserve nuclear architecture, we have reanalyzed the spatial organization of the initiation of mammalian DNA synthesis. Contrary to the commonly held view that replication begins at hundreds of dispersed nuclear sites, primary fibroblasts initiate synthesis in a limited number of foci that contain replication proteins, surround the nucleolus, and overlap with previously identified internal lamin A/C structures. These foci are established in early G(1)-phase and also contain members of the retinoblastoma protein family. Later, in S-phase, DNA replication sites distribute to regions located throughout the nucleus. As this progression occurs, association with the lamin structure and pRB family members is lost. A similar temporal progression is found in all the primary cells we have examined but not in most established cell lines, indicating that the immortalization process modifies spatial control of DNA replication. These findings indicate that in normal mammalian cells, the onset of DNA synthesis is coordinately regulated at a small number of previously unrecognized perinucleolar sites that are selected in early G(1)-phase.


Figures

Figure 1
Figure 1
Images of different replication patterns during S-phase progression. Panels from left to right reflect the progression of replication patterns during S-phase progression. Sites of BrdU incorporation were detected by an anti-BrdU antibody containing DNaseI (green, Amersham) and overlaid on DAPI staining of the nucleus (blue). The pattern labeled intermediate likely reflects a transition phase between focal and distributed patterns. All processed images were recompiled from images on several sections throughout the nucleus and, thus, reflect the staining pattern of the entire nucleus compressed into a two-dimensional image. The intensity of individual foci in the focal pattern is stronger than in the distributed pattern, although this is not apparent as a result of the imaging process.
Figure 2
Figure 2
DNA replication patterns in primary cells during S-phase progression. (A) FACS analysis was performed on WI38 cells released from contact inhibition. Upper panels plot cell number versus DNA content. Lower panels plot BrdU versus DNA content. Cells enter S-phase at ∼16 h postrelease and are in late S-phase by 24 h. (B) Quantitation of different replication patterns during S-phase progression. Only cells actively incorporating BrdU were included. (D) Images depict sites of BrdU incorporation either in the focal pattern (top) or the distributed pattern (bottom). These images were generated using standard immunofluorescence microscopy, which was used to generate all quantitative data.
Figure 2
Figure 2
DNA replication patterns in primary cells during S-phase progression. (A) FACS analysis was performed on WI38 cells released from contact inhibition. Upper panels plot cell number versus DNA content. Lower panels plot BrdU versus DNA content. Cells enter S-phase at ∼16 h postrelease and are in late S-phase by 24 h. (B) Quantitation of different replication patterns during S-phase progression. Only cells actively incorporating BrdU were included. (D) Images depict sites of BrdU incorporation either in the focal pattern (top) or the distributed pattern (bottom). These images were generated using standard immunofluorescence microscopy, which was used to generate all quantitative data.
Figure 3
Figure 3
Synchronization in early S-phase by hydroxyurea or aphidicolin results in the focal replication pattern. (A) WI-38 cells were released from contact inhibition into media containing BrdU and either 1.5 mM hydroxyurea, 2 μg/mL aphidicolin, or no drug. Twenty-four hours after release, cells were fixed, and immunofluorescence was performed. BrdU was detected by an anti-BrdU antibody containing DNaseI (Amersham, green). When cells are arrested in early S-phase by either hydroxyurea or aphidicolin, incorporation of BrdU is found only in perinucleolar foci. In contrast, when cells are allowed to progress through S-phase in the absence of drug, BrdU is incorporated throughout the nucleus. (B) Quantitation of patterns, comparing cells treated either with hydroxyurea, aphidicolin, or no drug. (C) WI-38 cells were released from contact inhibition into media containing 1.5 mM hydroxyurea. Twenty-four hours after release, the cells were washed in PBS and were restimulated into S-phase by replacement with drug-free media. Cells were pulse-labeled with BrdU for 10 min at hourly intervals after release. At 1 h, a majority of cells continue to display focal replication patterns. By 3–4 h after release, significant distribution of replication sites has occurred.
Figure 4
Figure 4
BrdU foci contain replication proteins and are associated with internal nuclear lamin A/C structures. (A) The localization of p150 (CAF-1; upper panels, green) and PCNA (lower panels, green) was determined during G1- and S-phase progression. At the G1-S boundary, both CAF-1 and PCNA foci increase in intensity. The mouse monoclonal antibody against p150 (MAB1) was kindly provided by B. Stillman. Similar results were seen with antibodies to the p60 subunit of CAF-1. PCNA was visualized with a rabbit polyclonal antibody (Santa Cruz). (B) Localization of BrdU was compared to that of p150 (red) in S-phase cells. DNaseI was used to expose BrdU. For this experiment, replication sites were detected using a rat anti-BrdU antibody (Harlan/Sera-Lab, green). (C) Early S-phase BrdU patterns were compared to that of UBF (upper panels, red), a nucleolar transcription factor, and nuclear lamins A/C (lower panels, red). The rabbit polyclonal anti-UBF antibody was kindly provided by L. Rothblum. Lamins A/C were visualized with a mouse monoclonal antibody (636, Santa Cruz). In all images, DNA is visualized by DAPI staining (blue).
Figure 5
Figure 5
The early S-phase focal replication pattern does not result from differential access of DNaseI. Each column reflects a single cell stained for DAPI (upper panels), BrdU incorporation (middle panels), or TUNEL (lower panels, Intergen) at the indicated DNaseI concentration. Cells were treated with DNaseI (Sigma) and stained with an anti-BrdU antibody (Becton Dickinson). After secondary antibody application, cells were processed for TUNEL staining.
Figure 6
Figure 6
HCl treatment is disruptive to nuclear structure. (A) Top panels compare sites of BrdU incorporation (Harlan/Sera-Lab, green) to localization p150 (CAF-1; red) with increasing acid concentration. No DNaseI is used in this experiment. At concentrations <1 N HCl, BrdU is not sufficiently exposed for detection. Lower panels depict nuclear lamins A/C localization (red) in increasing HCl concentration. (B) Cells were stained for BrdU with DNaseI and then exposed to HCl. BrdU incorporation sites (green, Becton Dickinson) are compared to the nucleolus as defined by staining with a human nucleolar autoantibody (red, Sigma; C).
Figure 7
Figure 7
Early S-phase replication appears focal using other methods to denature DNA. (A) Early S-phase BrdU incorporation sites (green) were compared using different methods to denature DNA. Using either heat exposure or base denaturation, early S-phase replication patterns appear focal. (B) Quantitation of replication patterns. Later in S-phase, denaturation by NaOH or heat yields a distributed pattern similar to that generated by DNaseI.
Figure 8
Figure 8
Immortalization alters the nuclear organization of DNA replication in early S-phase. (A) DNA replication patterns in MEFs during S-phase progression. BrdU incorporation sites (green, Becton Dickinson) are compared to the nucleolus as defined by staining with a human nucleolar autoantibody (red, Sigma). Ten units per milliliter DNaseI was used to visualize BrdU. (B) Quantitation of replication patterns for MEFs and NIH3T3 cells. FACS analysis (data not shown) demonstrated that NIH3T3 cells entered S-phase at 10 h, whereas MEFs entered at 12 h postrelease from contact inhibition. (C) Replication patterns in NIH3T3 cells arrested in early S-phase by hydroxyurea.
Figure 9
Figure 9
pRB family members localize to early S-phase sites of DNA synthesis. Synchronized cells were pulsed with BrdU in either early S-phase (upper panels) or mid-to-late S-phase (lower panels). Sites of DNA synthesis were determined in by indirect immunofluorescence (red) and compared to the localization pattern of pRB (green; A) or p130 (green; B). Overlapping signals appear yellow. (C) The localization patterns of replication proteins were compared to those of pRB family members in cells arrested in G1 by contact inhibition. Left panel: p130 (red), p150 (CAF-1; green). Right panel: p130 (green), Lamin A/C (red).

References

    1. Amati B, Gasser SM. Drosophila scaffold attached regions bind nuclear scaffolds and can function as ARS elements in both budding and fission yeasts. Mol Cell Biol. 1990;10:5442–5454. - PMC - PubMed
    1. Amiel A, Litmanovitch T, Lishner M, Mor A, Gaber E, Tangi I, Fejgin M, Avivi L. Temporal differences in replication timing of homologous loci in malignant cells derived from CML and lymphoma patients. Genes Chromosomes Cancer. 1998;22:225–231. - PubMed
    1. Berezney R, Buchholtz LA. Dynamic association of replicating DNA fragments with the nuclear matrix of regenerating liver. Exp Cell Res. 1981;132:1–13. - PubMed
    1. Berezney R, Dubey DD, Huberman JA. Heterogeneity of eukaryotic replicons, replicon clusters, and replication foci. Chromosoma. 2000;108:471–484. - PubMed
    1. Bravo R. Synthesis of the nuclear protein cyclin (PCNA) and its relationship with DNA replication. Exp Cell Res. 1986;163:287–293. - PubMed

Publication types