. 2000 Dec;74(24):11598-607.
doi: 10.1128/jvi.74.24.11598-11607.2000.

Enhancing B- and T-cell immune response to a hepatitis C virus E2 DNA vaccine by intramuscular electrical gene transfer

Affiliations

Enhancing B- and T-cell immune response to a hepatitis C virus E2 DNA vaccine by intramuscular electrical gene transfer

S Zucchelli et al. J Virol. 2000 Dec.

Abstract

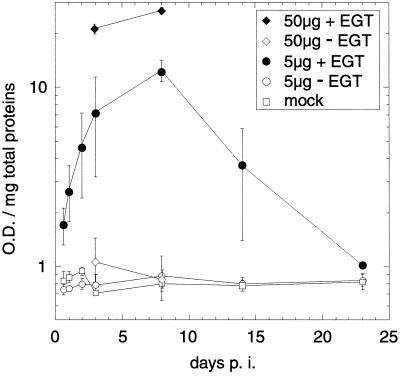
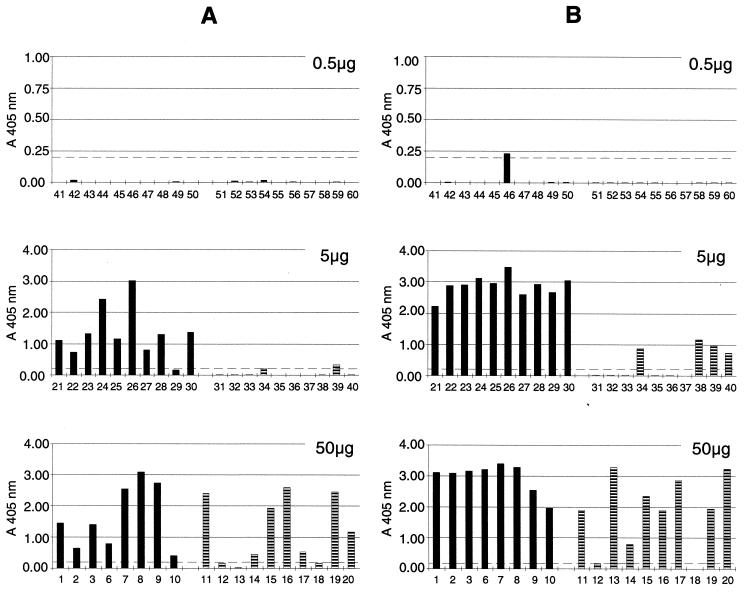
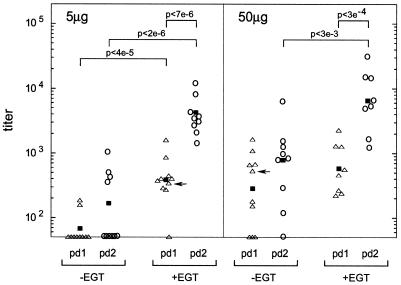
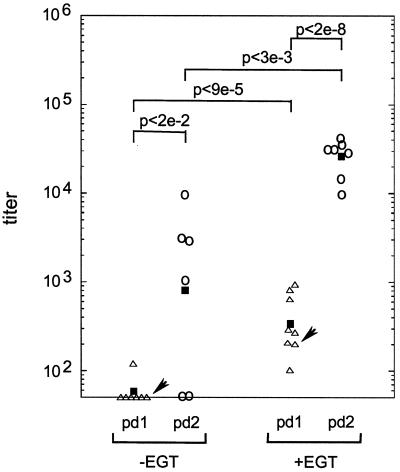
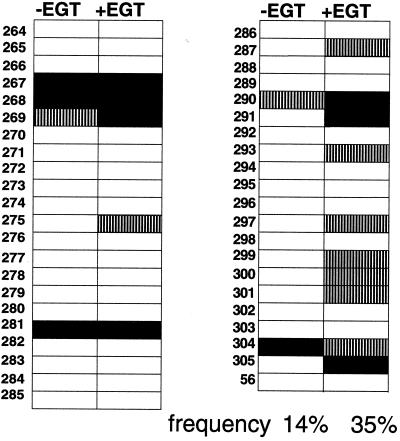
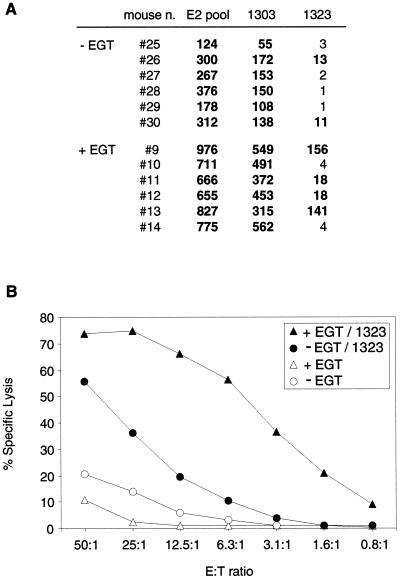
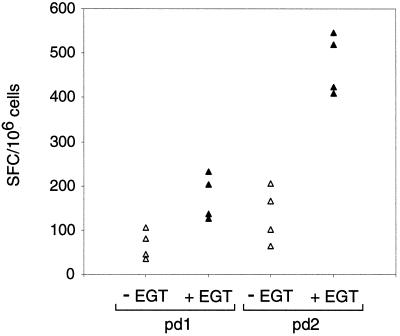
We describe an improved genetic immunization strategy for eliciting a full spectrum of anti-hepatitis C virus (HCV) envelope 2 (E2) glycoprotein responses in mammals through electrical gene transfer (EGT) of plasmid DNA into muscle fibers. Intramuscular injection of a plasmid encoding a cross-reactive hypervariable region 1 (HVR1) peptide mimic fused at the N terminus of the E2 ectodomain, followed by electrical stimulation treatment in the form of high-frequency, low-voltage electric pulses, induced more than 10-fold-higher expression levels in the transfected mouse tissue. As a result of this substantial increment of in vivo antigen production, the humoral response induced in mice, rats, and rabbits ranged from 10- to 30-fold higher than that induced by conventional naked DNA immunization. Consequently, immune sera from EGT-treated mice displayed a broader cross-reactivity against HVR1 variants from natural isolates than sera from injected animals that were not subjected to electrical stimulation. Cellular response against E2 epitopes specific for helper and cytotoxic T cells was significantly improved by EGT. The EGT-mediated enhancement of humoral and cellular immunity is antigen independent, since comparable increases in antibody response against ciliary neurotrophic factor or in specific anti-human immunodeficiency virus type 1 gag CD8(+) T cells were obtained in rats and mice. Thus, the method described potentially provides a safe, low-cost treatment that may be scaled up to humans and may hold the key for future development of prophylactic or therapeutic vaccines against HCV and other infectious diseases.


Figures

FIG. 1
FIG. 1
EGT of vaccine DNA vector increases the efficiency of antigen expression in mouse muscle. HCV E2 in vivo expression was measured by ELISA on crude muscle extracts from mice injected with 5 μg of pF78E2 plasmid as described in Materials and Methods. A follow-up experiment was performed by injecting 50 μg of the same plasmid to confirm peak levels observed in the 5-μg time course. The horizontal axis indicates the number of days postinjection (p.i.). For each time point, extracts from three injected mice were prepared and E2 expression levels were determined by ELISA with an anti-E2 MAb. Average values (A405) from two replicates were determined and normalized over the total amount of extracted proteins as reported on the vertical axis (OD/milligram of total proteins). Error bars represent the standard deviation values. E2 expression was measured in mice injected with 50 μg of pF78E2 plasmid with EGT (⧫, 50 μg + EGT), 50 μg of pF78E2 plasmid without EGT (◊, 50 μg − EGT), 5 μg of pF78E2 plasmid with EGT (●, 5 μg + EGT), 5 μg of pF78E2 plasmid without EGT (○, 5 μg − EGT), or PBS alone (□, mock).
FIG. 2
FIG. 2
EGT increases the frequency of seroconversion of pF78E2-injected mice. Seroconversion was measured by ELISA on recombinant E2 as described in Materials and Methods. Sera from individual mice (indicated on the horizontal axis) were tested in duplicate at a 1:100 dilution, and average values (A405) are reported. Results from EGT-treated mice are represented by black bars; hatched bars indicate the reactivity of sera from untreated mice. Values below the dotted lines (two times the background) were considered negative. Results from animals injected with 0.5, 5, and 50 μg are shown in the upper, medium, and lower panels, respectively. (A) Post-dose 1 sera. (B) Post-dose 2 sera.
FIG. 3
FIG. 3
EGT increases antibody titers of pF78E2 injected mice. Individual titers against recombinant E2 were measured by ELISA on each serum from EGT-treated (+EGT) and untreated (−EGT) animals after one (pd1, ▵) or two (pd2, ○) intramuscular injections of 5 or 50 μg of pF78E2 plasmid. The doses were administered 3 weeks apart. Individual titers (all open symbols) and cohort GMTs (■) from EGT-treated and untreated animals are reported. The P values are shown between groups which gave statistically significant differences. The lowest serum dilution tested was 1:100. Samples that did not seroconvert were assigned an endpoint titer of 50. One animal from the +EGT group given 5 μg and one animal from the −EGT group given 50 μg were not given the booster injection (indicated by arrows).
FIG. 4
FIG. 4
Enhanced antibody response in EGT-treated rabbits immunized with pF78E2. Individual animal anti-E2 antibody titers in sera from rabbits immunized with the 3-mg dose of the pF78E2 plasmid were determined by ELISA on serum samples collected 3 weeks after the first (pd1, ▵) or the second (pd2, ○) injection. The doses were administered 4 weeks apart. Cohort GMTs are shown (■), and P values are shown above the bars connecting the correlates. The lowest serum dilution tested was 1:100. Samples that did not seroconvert were assigned an endpoint titer of 50. One animal from each immunization group was not given the booster injection (indicated by arrows).
FIG. 5
FIG. 5
EGT increases the level of serum cross-reactivity against different HVR1 sequences from natural viral isolates. The cross-reactivity of pools of sera from pF78E2-immunized BALB/c mice with (+EGT) or without (−EGT) electrical stimulation was measured by ELISA using 43 synthetic peptides reproducing different HVR1 sequences (indicated in the left column) as coated antigens. The data reported refer to post-dose 2 sera from animals immunized with two injections of 50 μg of DNA. For each serum pool, average values (A405) from two replicates have been determined. Results are expressed as the difference between the average value of the tested peptide and that of an unrelated peptide. Positive values were differing more than 3ς from the background signal observed on the unrelated peptide. White boxes represent values below the background; hatched boxes indicate signals differing from those observed on the unrelated peptide between 0.1 and 0.4 OD405; black boxes indicate values differing by more than 0.4 OD405. The level of cross-reactivity of each serum is indicated at the bottom of each column and is expressed as the percentage of positive peptides over the total number of tested peptides (frequency).
FIG. 6
FIG. 6
EGT improves the T-cell response against HCV E2. (A) BALB/c mice receiving two doses of 50 μg of pF78E2 plasmid with (+EGT) or without EGT (−EGT) were analyzed for the induction of E2-specific cellular immunity. At 3 weeks after the boosting injection, the number of IFN-γ-secreting anti-E2 T cells was determined by ELISPOT on splenocytes from individual mice (indicated in the first column) using a pool of overlapping 20mer synthetic peptides encompassing the HCV E2 sequence (strain H) from aa 371 to 700 (E2 pool). IFN-γ-secreting CD4+ T cells were evaluated using peptide 1303, and the number of E2-specific IFN-γ-secreting CD8+ T cells was measured using peptide 1323. Two independent experiments were performed, with each one testing two different amounts of splenocytes (2.5 × 10⁵ and 5 × 10⁵) and two replicates for each tested amount of splenocytes. Average values were calculated, from the background level determined in the absence of peptides (typically less than 10 SFC/106 total splenocytes) was subtracted, and the result was expressed as the number of SFC/106 total splenocytes. Numbers corresponding to more than three times the background measured in control experiments without antigenic peptides were considered positive values and are indicated in boldface. (B) E2-specific CTL response in pF78E2-immunized representative mice from the +EGT (triangles) and −EGT (circles) groups. Splenocytes from immunized mice were restimulated in vitro and tested for cytotoxic activity against p815 cells pulsed with the HCV peptide 1323 (1323; closed symbols) or dimethyl sulfoxide (open symbols). Effector cell/target cell ratios are indicated in the abscissa. The percentage of specific killing is reported on the vertical axis. Each number represents the average of two independent experiments.
FIG. 7
FIG. 7
EGT improves T-cell response against HIV-1 gag. BALB/c mice were injected with one (pd1) or two (pd2) doses of 5 μg of pHIV-1 gag plasmid. At 3 weeks after each injection, the number of IFN-γ-secreting anti-HIV-1 gag CD8+ T cells was determined by ELISPOT on pooled splenocytes from two immunized mice using a synthetic peptide-reproducing gag amino acid sequence between residues 197 and 205. Two different amounts of splenocytes (2.5 × 10⁵ and 5 × 10⁵) were tested with three replicates for each tested amount of splenocytes. Average values were calculated, the background level determined in the absence of the gag peptide (typically less than 10 SFC/106 total splenocytes) was subtracted, and the result was expressed as the number of SFC/106 total splenocytes. Black triangles represent the number of SFC/106 cells in EGT-treated mice (+EGT); open triangles indicate the IFN-γ-secreting anti-HIV-1 gag CD8+ T cells in untreated animals (−EGT). The difference between −EGT and +EGT groups are statistically significant (P < 0.01 and P < 0.0002 after one or two doses, respectively).

References

    1. Aihara H, Miyazaki J. Gene transfer into muscle by electroporation in vivo. Nat Biotechnol. 1998;9:867–870. - PubMed
    1. Alter H J. To C or not to C: these are the questions. Blood. 1995;85:1681–1695. - PubMed
    1. Babiuk L A, van Drunen Littel-van den Hurk, Babiuk S L. Immunization of animals: from DNA to the dinner plate. Vet Immunol Immunopathol. 1999;72:189–202. - PubMed
    1. Banga A K, Prausnitz M R. Assessing the potential of skin electroporation for the delivery of protein- and gene-based drugs. Trends Biotechnol. 1998;10:408–412. - PubMed
    1. Berglund P, Smerdou C, Fleeton M N, Tubulekas I, Liljestrom P. Enhancing immune responses using suicidal DNA vaccines. Nat Biotechnol. 1998;6:562–565. - PubMed

MeSH terms