. 2000 Dec;74(24):11697-707.
doi: 10.1128/jvi.74.24.11697-11707.2000.

Lack of shielding of primer binding site silencer-mediated repression of an internal promoter in a retrovirus vector by the putative insulators scs, BEAD-1, and HS4

Affiliations

Lack of shielding of primer binding site silencer-mediated repression of an internal promoter in a retrovirus vector by the putative insulators scs, BEAD-1, and HS4

C Modin et al. J Virol. 2000 Dec.

Abstract

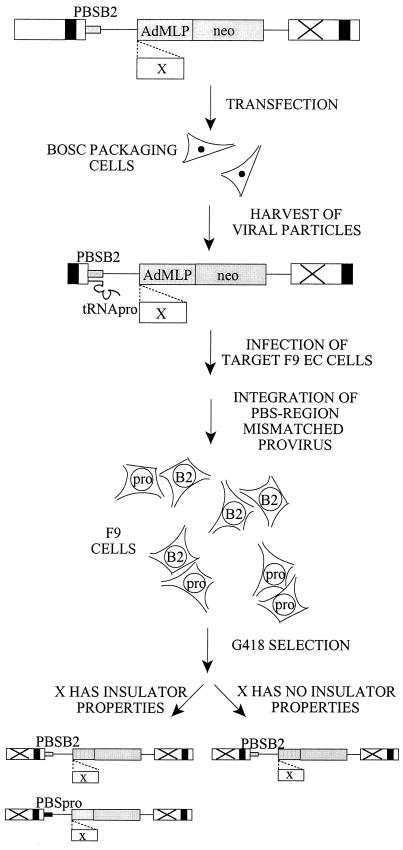
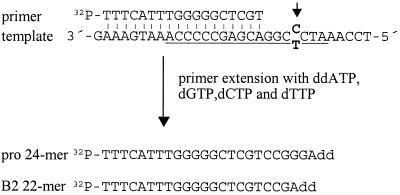
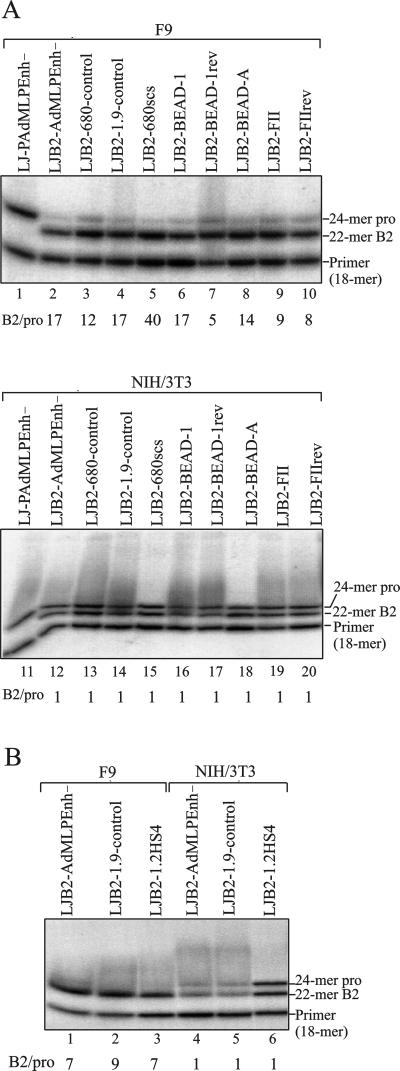
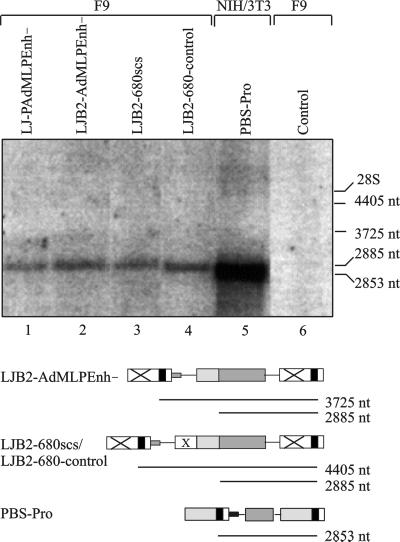
A major determinant for transcriptional incompetence of murine leukemia virus (MLV) and MLV-derived vectors in embryonal cells is located at the proline primer binding site (PBS). The mechanism of silencing is unknown, yet the effect is capable of spreading to adjacent promoters. Based on a retroviral vector containing an internal promoter and the escape mutant B2 PBS with expressional capacity in embryonal cells, we have developed an assay to test the ability of putative insulators to shield the silencer at the PBS. Since the B2 PBS reverts to the wild-type PBS at high frequency, a shielding ability of a putative insulator can be assessed from the ratio of expressing B2 PBS to proline PBS proviruses in the target embryonal carcinoma cell population as measured by primer extension. Our results show that none of the possible insulators, scs, BEAD-1, or HS4, is able to shield an internal promoter from the repressive effect of the silencer at the PBS region when inserted between the silencer and the promoter.


Figures

FIG. 1
FIG. 1
Retroviral vectors. (A) Vectors based on Akv MLV (grey LTR) or MoMLV (white LTR) containing either SV40-neo, AdMLP-neo expression cassettes, or neo and a Pro PBS (PBSpro, black box), B2 PBS (PBSB2, grey box), or Gln PBS (PBSgln, white box). LJ-P, LJ-Q, LJ-PAdMLPEnh−, and LJ-QAdMLPEnh− were obtained from Petersen et al. (49). PBS-Pro was from Lund et al. (40). PL, polylinker; small cross, mutation of the TATA box; large cross, deletion of the enhancer. (B) Vectors based on LJB2-AdMLPEnh− with insertion of control sequences or putative insulators. revGFP, 680-bp reverse-oriented cDNA sequence from the GFP gene; revALFGFP, a total of 1.9 kb of cDNA sequence from the GFP gene and the ALF1 gene in reverse orientation; scs, 680-bp specialized chromatin structures from Drosophila; BEAD-1, 1,970-bp BEAD-1 from the human T-cell receptor α/δ gene in forward (→) or reverse (←) orientation; BEAD-A, 120-bp subfragment of BEAD-1; FII, 42-bp binding site sequence for CTCF in forward (→) or reverse (←) orientation; HS4, 1.2-kb hypersensitive site 4 of the chicken β-globin locus. Not drawn to scale.
FIG. 2
FIG. 2
Assay for shielding of the PBS silencer by insulators. A retroviral vector with a B2 PBS and an internal AdMLP driving neo expression is transfected into transient-packaging cells. Virus particles contain a B2-Pro mismatch at the PBS region in the RNA genome, resulting in both Pro PBS- and B2 PBS-containing proviruses in the target cell population. Due to restriction of the Pro PBS vector in EC cells, only the B2 PBS vector will be present after selection for neo expression (right), while a DNA element (X) capable of shielding the internal promoter from the silencer gives rise to a cell population of both Pro and B2 proviruses (left).
FIG. 3
FIG. 3
Primer extension assay for analysis of transduced proviruses. The PBS (underlined) and surrounding sequences are shown with the 18-mer end-labeled extension primer annealed. The arrow points to the position of the divergent nucleotide (bold), T in B2 PBS and C in Pro PBS. Extension was terminated by incorporation of a ddATP analog, resulting in a 22-mer extension product from a B2 PBS template and a 24-mer product from a Pro PBS template. The products were resolved by polyacrylamide gel electrophoresis.
FIG. 4
FIG. 4
Primer extension analysis of transduced vector proviruses with putative insulators. Genomic DNA from G418-selected populations of F9 and NIH 3T3 cells transduced in parallel with vectors as indicated above each lane were employed for PCRs with primers specifically amplifying the transduced provirus. Amplified fragments were subjected to primer extension dideoxy termination analysis with an end-labeled primer as shown in Fig. 3 to analyze the presence of Pro PBS and B2 PBS proviruses. Extension products were resolved by denaturing polyacrylamide gel electrophoresis, visualized after exposure in a Personal Molecular Imager Fx, and quantified by using Quantity One software. The ratio of B2 PBS to Pro PBS band intensities is given below each lane. Panels A and B are from two independent experiments.
FIG. 5
FIG. 5
Proviral neo transcripts in F9 cells. RNA was extracted from G418-selected populations transduced by viral supernatant from transfected BOSC 23 cells. Twenty micrograms of total RNA was resolved by denaturing agarose gel electrophoresis, blotted onto Zeta-Probe membranes, and hybridized with a neo-specific probe. The blot was exposed in a PhosphorImager Fx and visualized by using ImageQuant software. The expected sizes of transcripts initiated from the LTR or the internal promoter are delineated below each vector, using the graphic representation from Fig. 1. Position of bands in the gel were inferred from the location of 28S (4.7 kb) and 18S (1.9 kb) ribosomal bands seen on ethidium bromide staining of the agarose gel. NIH 3T3 cells transduced with PBS-Pro (lane 5) were included as a size marker. Control, untransduced F9 cells.
FIG. 6
FIG. 6
Electrophoretic mobility shift assay with a CTCF-binding probe. A 10-μg sample of nuclear extract from F9 cells (A) or NIH 3T3 cells (B) was incubated with radiolabeled CTCF-binding probe F1 and competed with increasing amounts (25- to 1,000-fold molar excess) of either cold F1 probe (left) or cold unspecific probe (right). The gel was exposed in a Personal Molecular Imager Fx and visualized in Quantity One.

References

    1. Akgün E, Ziegler M, Grez M. Determinants of retrovirus gene expression in embryonal carcinoma cells. J Virol. 1991;65:382–388. - PMC - PubMed
    1. Baniahmad A, Steiner C, Köhne A C, Renkawitz R. Modular structure of a chicken lysozyme silencer: involvement of an unusual thyroid hormone receptor binding site. Cell. 1990;61:505–514. - PubMed
    1. Barklis E, Mulligan R C, Jaenisch R. Chromosomal position or virus mutation permits retrovirus expression in embryonal carcinoma cells. Cell. 1986;47:391–399. - PubMed
    1. Beck E, Ludwig G, Auerswald E A, Reiss B, Schaller H. Nucleotide sequence and exact localization of the neomycin phosphotransferase gene from transposon Tn5. Gene. 1982;19:327–336. - PubMed
    1. Bell A C, West A D, Felsenfeld G. The protein CTCF is required for the enhancer blocking activity of vertebrate insulators. Cell. 1999;98:387–396. - PubMed

Publication types

LinkOut - more resources