. 2000 Oct;6(4):921-9.
doi: 10.1016/s1097-2765(05)00087-0.

Structural basis of SNT PTB domain interactions with distinct neurotrophic receptors

Affiliations

Structural basis of SNT PTB domain interactions with distinct neurotrophic receptors

C Dhalluin et al. Mol Cell. 2000 Oct.

Abstract

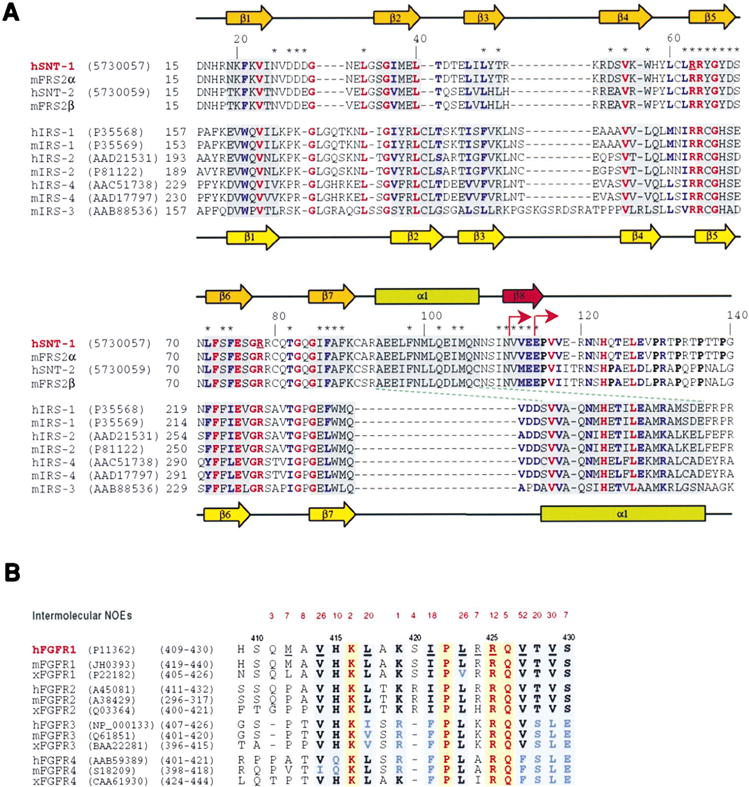
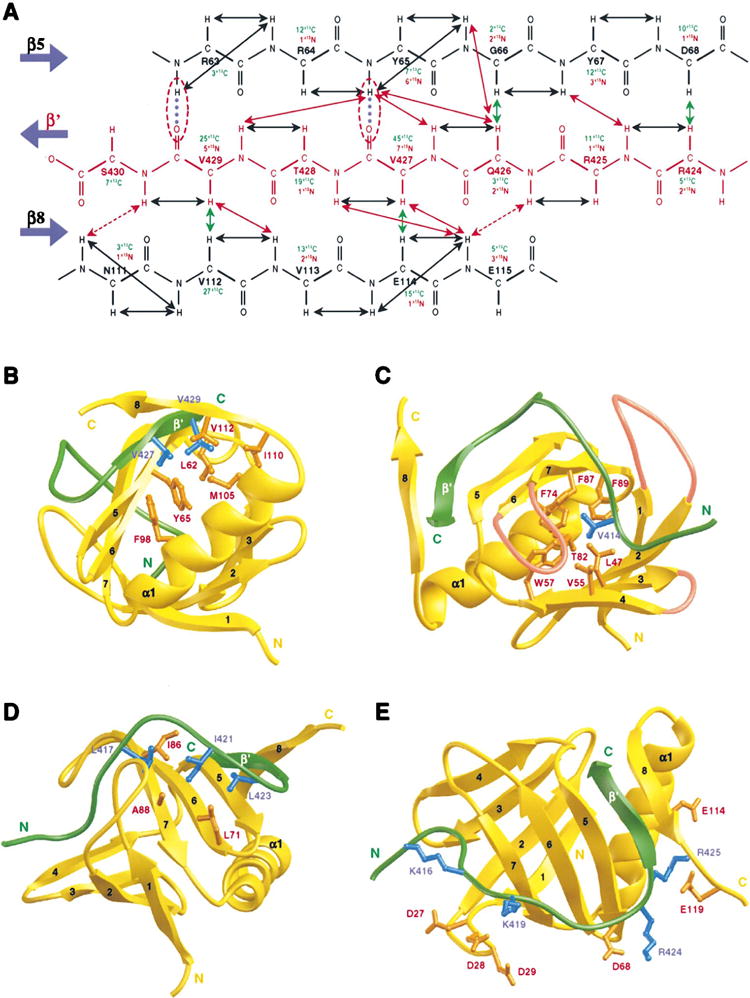
SNT adaptor proteins transduce activation of fibroblast growth factor receptors (FGFRs) and neurotrophin receptors (TRKs) to common signaling targets. The SNT-1 phosphotyrosine binding (PTB) domain recognizes activated TRKs at a canonical NPXpY motif and, atypically, binds to nonphosphorylated FGFRs in a region lacking tyrosine or asparagine. Here, using NMR and mutational analyses, we show that the PTB domain utilizes distinct sets of amino acid residues to interact with FGFRs or TRKs in a mutually exclusive manner. The FGFR1 peptide wraps around the beta sandwich structure of the PTB domain, and its binding is possibly regulated by conformational change of a unique C-terminal beta strand in the protein. Our results suggest mechanisms by which SNTs serve as molecular switches to mediate the essential interplay between FGFR and TRK signaling during neuronal differentiation.


Figures

Figure 1
Figure 1. Protein Sequence Homology Alignment
(A) Sequence alignment of PTB domains of the SNT and IRS proteins. Amino acid sequence and accession numbers of the proteins are indicated along the protein sequences. Protein sequences of FRS2α and FRS2β were reported previously (Ong et al., 2000). The experimentally determined secondary-structural elements are displayed above or below the sequences of the PTB domains of SNTs or IRSs (Zhou et al., 1996), respectively. Asterisks highlight residues in the SNT-1 PTB domain that show intermolecular NOEs to the hFGFR1 peptide. Absolutely or highly conserved residues among the SNT and IRS PTB domains are shown in red and blue, respectively. Two underlined arginine residues of SNT-1 were both changed by site-directed mutagenesis to glutamine. Arrows indicate constructs used in truncation analysis of the binding of the SNT-1 PTB domain to hFGFR1 or TRK. Proline residues located C-terminal to the SNT-1 PTB domain are shown in bold. (B) Sequence alignment of the juxtamembrane region of the FGFR family. For each FGFR group (FGFR1–4), protein sequences from three representative species (i.e., human, mouse, and Xenopus) are selected. The number of observed intermolecular NOEs identified for a particular amino acid residue of the hFGFR1 peptide is shown in red above the sequence. Absolutely or highly conserved residues are highlighted in yellow and blue backgrounds, respectively.
Figure 2
Figure 2. Structure of the SNT-1 PTB Domain/hFGFR1 Complex
(A) Stereoview of the backbone atom superposition of the final 20 NMR-derived structures of the complex. The figure shows the SNT-1 PTB domain residues 18–116 and the hFGFR1 peptide residues 411–430. The terminal residues, which are structurally disordered, are omitted for clarity. For the final 20 structures, the root-mean-square deviations (rmsd) of the backbone and all heavy atoms for protein residues 18–116 are 0.74 ± 0.16 Å and 1.46 ± 0.16 Å, respectively. The corresponding rmsd for the protein secondary- structural regions (protein residues 19–24, 35–40, 45–49, 52–57, 63–68, 71–76, 85–90, 94–107, and 111–115) are 0.40 ± 0.05 A and 0.88 ± 0.05 A, respectively. The rmsd of the backbone and all heavy atoms for the hFGFR1 peptide (residues 412–430) are 0.56 ± 0.10 Å and 1.25 ± 0.15 Å, respectively. (B) Ribbons (Carson, 1991) depiction of the averaged minimized NMR structure of the SNT-1 PTB domain/hFGFR1 complex. The orientation of (B) is as shown in (A). (C) Ribbon diagram of the SNT-1 PTB domain structure from the top of the protein, which is rotated ~90° from the orientation in (B). (D) Molecular surface representation of the SNT-1 PTB domain structure calculated in GRASP (Nicholls et al., 1993). The protein is color coded by surface curvature, and the color gradient from green to dark gray reflects decreasing solvent exposure. The hFGFR1 peptide molecule is shown as a ball-and-stick representation color coded by atom type.
Figure 3
Figure 3. Intermolecular Interactions in the SNT-1 PTB Domain/hFGFR1 Complex
(A) Secondary structure of the intermolecular antiparallel β sheet of the complex. The number of intermolecular NOEs observed in 13C- or 15N-edited (F1), 13C/15N-filtered (F3) 3D NOESY spectra is summarized for individual amino acid residues. NOEs that define the structure of the β sheet are indicated by arrows. Arrows for intramolecular, 13C- and 15N-based intermolecular NOEs are color coded in black, green, and red, respectively. Broken lines (blue) highlight two intermolecular hydrogen bonds that are supported by amide exchange data. The intermolecular interactions are depicted for three regions of the hFGFR1 peptide (green). (B) The C-terminal region of the hFGFR1 peptide (residues 424–430). The side chains of the protein and the peptide residues are displayed in orange and blue, respectively. (C) The middle region of the hFGFR1 peptide (residues 417–423). The three loops that connect β1 to β2, β3 to β4, and β6 to β7 and that form a hydrophobic binding pocket for binding to the peptide residue Val-414 are colored in pink. (D) The N-terminal region of the hFGFR1 peptide (residues 409–416). (E) Complementary electrostatic interactions between the SNT-1 PTB domain and hFGFR1 peptide residues.
Figure 4
Figure 4. Mutational Analysis of the SNT-1 PTB Domain Interactions with FGFRs or TRKs
(A) Effects of hFGFR1 point mutations on interactions with the SNT-1 PTB domain as determined by yeast two-hybrid binding assays. Data for peptide mutants are calculated from an average of five independent experiments. Western blot shows BD fusion protein expression of wild-type and mutant hFGFR1 in the yeast cells. (B) Structure of the SNT-1 PTB domain/hFGFR1 complex shows locations of Arg-63 and Arg-78 (blue) that are essential for binding to the phosphotyrosine in the NPXpY motif. The backbone of the hFGFR1 peptide is shown in green. The distinct β8 strand of the SNT-1 PTB domain is displayed in red. (C) Structure of the IRS-1 PTB domain in complex with a tyrosine-phosphorylated peptide derived from interleukin-4 receptor (LVIAGNPApYRS, residues 489–499) as determined by NMR (Zhou et al., 1996). The peptide residues are shown in green, and the two key arginine residues (Arg-212 and Arg-227) of the PTB domain that are essential for phosphotyrosine binding are displayed in blue. (D) Yeast two-hybrid binding studies of the effect of truncation of SNT-1 β8 on its interactions with hFGFR1 and tyrosine-phosphorylated TRKB. The panel framed in red shows the loss of interaction between hFGFR1 and the SNT-1 PTB domain protein lacking the β8 strand. Colony formation on the synthetic complete medium lacking leucine and tryptophan (Leu, Trp) illustrates the efficiency of cotransformation with the two plasmids, while growth on the corresponding medium lacking histidine, leucine, and tryptophan (His, Leu, Trp) shows the level of protein-protein interaction.

References

    1. Birren SJ, Anderson DJ. A v-myc immortalized sympathoadrenal progenitor cell line in which neuronal differentiation is initiated by FGF but not NGF. Neuron. 1990;4:189–201. - PubMed
    1. Blaikie P, Immanuel D, Wu J, Li N, Yajnik V, Margolis B. A region in Shc distinct from the SH2 domain can bind a tyrosine phosphorylated growth factor receptor. J Biol Chem. 1994;269:32031–32034. - PubMed
    1. Borg JP, Ooi J, Levy E, Margolis B. The phosphotyrosine interaction domains of X11 and Fe65 bind to distinct sites on the YENPTY motif of amyloid precursor protein. Mol Cell Biol. 1996;16:6229–6241. - PMC - PubMed
    1. Brünger AT. X-PLOR Version 3.1:ASystem for X-Ray Crystallography and NMR, Version 3.1 Edition. New Haven, CT: Yale University Press; 1993.
    1. Carson M. Ribbons 2.0. J Appl Crystallogr. 1991;24:958–961.

Publication types

MeSH terms

LinkOut - more resources