

Determinants of blood pH in health and disease
- PMID: 11094491
- PMCID: PMC137247
- DOI: 10.1186/cc644
Determinants of blood pH in health and disease
Abstract
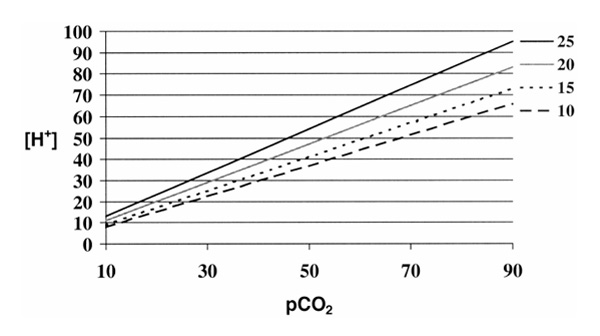
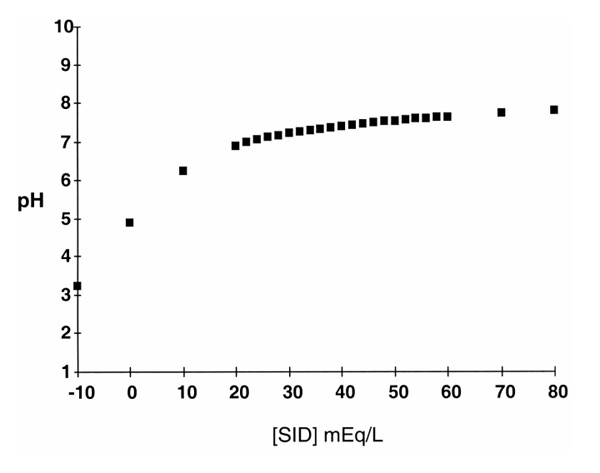
An advanced understanding of acid-base physiology is as central to the practice of critical care medicine, as are an understanding of cardiac and pulmonary physiology. Intensivists spend much of their time managing problems related to fluids, electrolytes, and blood pH. Recent advances in the understanding of acid-base physiology have occurred as the result of the application of basic physical-chemical principles of aqueous solutions to blood plasma. This analysis has revealed three independent variables that regulate pH in blood plasma. These variables are carbon dioxide, relative electrolyte concentrations, and total weak acid concentrations. All changes in blood pH, in health and in disease, occur through changes in these three variables. Clinical implications for these findings are also discussed.
Figures
References
-
- Kellum JA. Diagnosis and treatment of acid–base disorders. Textbook of Critical Care. Edited by Grenvik A, Shoemaker PK, Ayers S, Holbrook PR. Philadelphia, PA: WB Saunders Co, 1999. pp. 839–853.
-
- Severinghaus JW. Siggard-Andersen and the 'great trans-Atlantic acid–base debate'. Scand J Clin Lab Invest. 1993;53 (suppl 214):99–104. - PubMed
-
- Siggard-Andersen O, Foch-Andersen N. Base excess or buffer base (strong ion difference) as measure of a non-respiratory acid–base disturbance. Acta Anaesthiol Scand. 1995;39(suppl 107):123–128. - PubMed
-
- Worthley L. Strong ion difference: a new paradigm or new clothes for the acid–base emperor. Crit Care Resusc. 1999;1:211–214. - PubMed
-
- Severinghaus JW. More RipH [letter]. JAMA. 1992;267:2035–2036. - PubMed
Publication types
MeSH terms
LinkOut - more resources
Full Text Sources
Other Literature Sources
Medical
