Review
. 2000;4(5):282-9.
doi: 10.1186/cc710. Epub 2000 Sep 1.

Using heart-lung interactions to assess fluid responsiveness during mechanical ventilation

Affiliations
Review

Using heart-lung interactions to assess fluid responsiveness during mechanical ventilation

F Michard et al. Crit Care. 2000.

Abstract

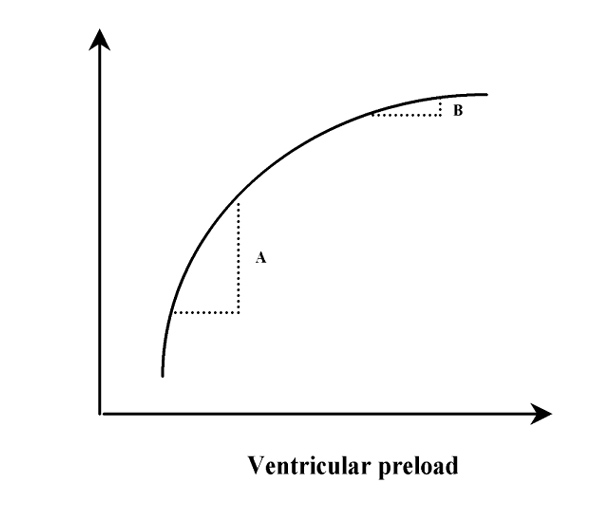
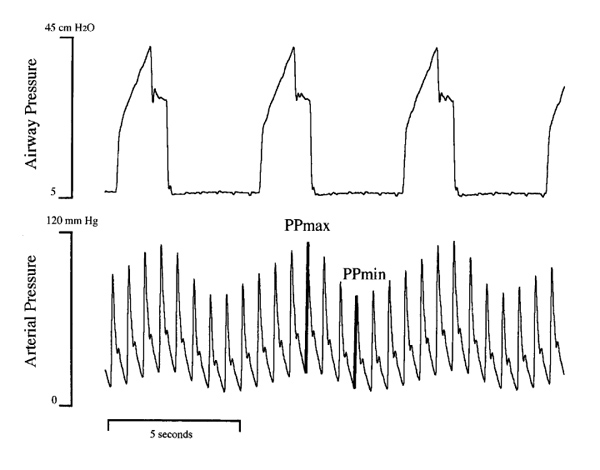
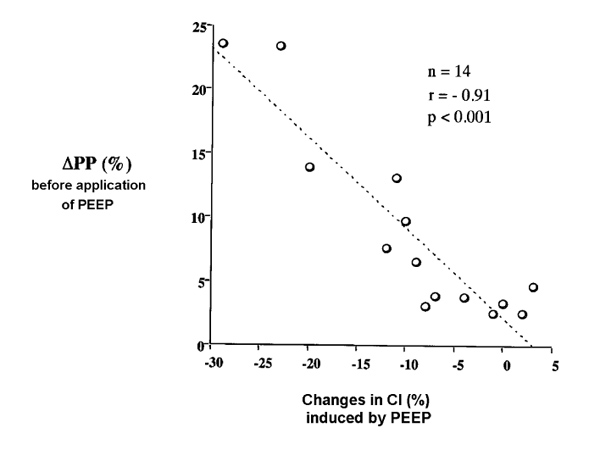
According to the Frank-Starling relationship, a patient is a 'responder' to volume expansion only if both ventricles are preload dependent. Mechanical ventilation induces cyclic changes in left ventricular (LV) stroke volume, which are mainly related to the expiratory decrease in LV preload due to the inspiratory decrease in right ventricular (RV) filling and ejection. In the present review, we detail the mechanisms by which mechanical ventilation should result in greater cyclic changes in LV stroke volume when both ventricles are 'preload dependent'. We also address recent clinical data demonstrating that respiratory changes in arterial pulse (or systolic) pressure and in Doppler aortic velocity (as surrogates of respiratory changes in LV stroke volume) can be used to detect biventricular preload dependence, and hence fluid responsiveness in critically ill patients.


Figures

Figure 1
Figure 1
Schematic representation of Frank-Starling relationship between ventricular preload and stroke volume. A given change in preload induces a larger change in stroke volume when the ventricle operates on the ascending portion of the relationship (A, condition of preload dependence) than when it operates on the flat portion of the curve (B, condition of preload independence).
Figure 2
Figure 2
Schematic representation of Frank-Starling relationships between ventricular preload and stroke volume in a normal heart (A) and in a failing heart (B). A given value of preload can be associated with preload dependence in a normal heart or with preload independence in a failing heart.
Figure 3
Figure 3
Haemodynamic effects of mechanical insufflation. The LV stroke volume is maximum at the end of the inspiratory period and minimum two to three heart beats later (ie during the expiratory period). The cyclic changes in LV stroke volume are mainly related to the expiratory decrease in LV preload due to the inspiratory decrease in RV filling and output.
Figure 4
Figure 4
Respiratory changes in systolic pressure in a mechanically ventilated patient. The difference between the maximal and minimal value of systolic pressure over a single respiratory cycle is called SPV (for Systolic Pressure Variation). The reference systolic pressure is measured during an end-expiratory pause (line of reference) and SPV is divided in two components: Δup and Δdown. Δup is the difference between the maximal and the reference systolic pressure. Δdown is the difference between the reference and the minimal systolic pressure. Adapted with permission [33].
Figure 5
Figure 5
Respiratory changes in airway and arterial pressures in a mechanically ventilated patient. The pulse pressure (systolic minus diastolic pressure) is maximal (PPmax) at the end of the inspiratory period and minimal (PPmin) three heart beats later (ie during the expiratory period). The respiratory changes in pulse pressure (ΔPP) are calculated as the difference between PPmax and PPmin, divided by the mean of the two values, and expressed as a percentage (see text for details). Adapted with permission [33].
Figure 6
Figure 6
Relationship between the respiratory changes in pulse pressure before volume expansion (Baseline ΔPP) and the volume expansion-induced changes in cardiac index (y-axis) in 40 septic patients with acute circulatory failure. The higher ΔPP is before volume expansion, the more marked the increase in cardiac index induced by volume expansion. Adapted with permission [7].
Figure 7
Figure 7
Relationship between the respiratory changes in pulse pressure on ZEEP (y-axis) and the PEEP-induced changes in cardiac index (x-axis) in 14 ventilated patients with acute lung injury. The higher ΔPP is on ZEEP, the more marked the decrease in cardiac index induced by PEEP. Adapted with permission [43].

References

    1. Braunwald E, Sonnenblick EH, Ross J. Mechanisms of cardiac contraction and relaxation. Heart Disease. Edited by Braunwald E. Philadelphia: WB Saunders company; 1988. pp. 383–425.
    1. Nixon JV, Murray RG, Leonard PD, Mitchell JH, Blomqvist CG. Effect of large variations in preload on left ventricular performance characteristics in normal subjects. Circulation. 1982;65:698–703. - PubMed
    1. Boldt J, Lenz M, Kumle B, Papsdorf M. Volume replacement strategies on intensive care units: results from a postal survey. . Intensive Care Med. 1998;24:147–151. doi: 10.1007/s001340050536. - DOI - PubMed
    1. Calvin JE, Driedger AA, Sibbald WJ. The hemodynamic effect of rapid fluid infusion in critically ill patients. Surgery. 1981;90:61–76. - PubMed
    1. Reuse C, Vincent JL, Pinsky MR. Measurements of right ventricular volumes during fluid challenge. Chest. 1990;98:1450–1454. - PubMed

MeSH terms