. 2000 Dec 19;97(26):14438-43.
doi: 10.1073/pnas.250413397.

Cryptic vicariance in the historical assembly of a Baja California peninsular desert biota

Affiliations

Cryptic vicariance in the historical assembly of a Baja California peninsular desert biota

B R Riddle et al. Proc Natl Acad Sci U S A. .

Abstract

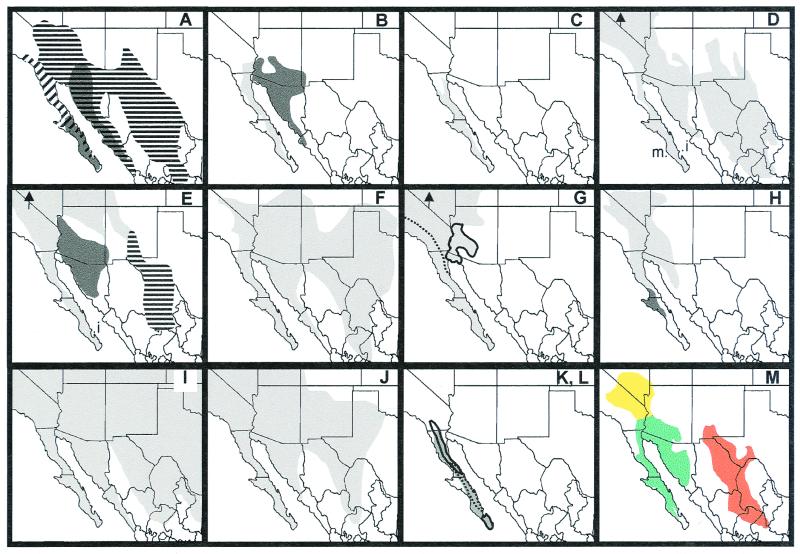
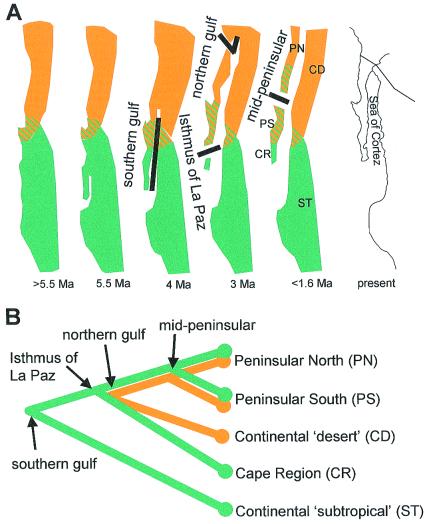
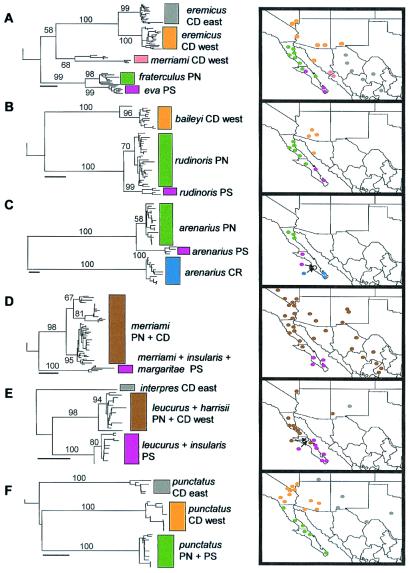
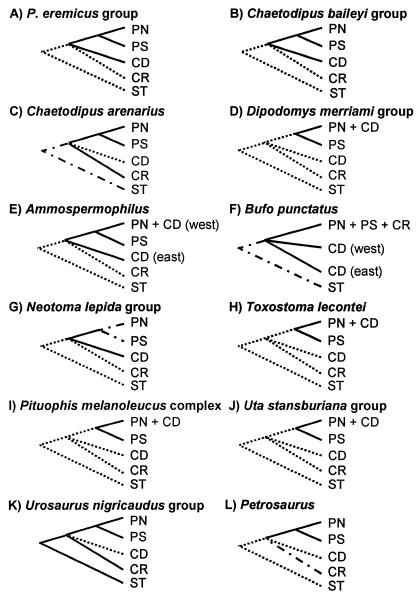
We use analyses of phylogeographic population structure across a suite of 12 mammalian, avian, amphibian, and reptilian species and species-groups to assess the role of Late Miocene to Pleistocene geological history in the evolution of a distinct Baja California Peninsular Desert biota. Comparative examination of phylogroup distributions provides support for previously hypothesized vicariant events produced by: a middle Pleistocene midpeninsular seaway, a late Pliocene northward transgression of the Sea of Cortéz, and a Pliocene seaway across the southern peninsular Isthmus of La Paz. Most of this phylogeographic architecture is cryptically embedded within widespread taxonomic species and species-groups, such that the unique evolutionary history of the Peninsular Desert has been obscured and ignored. The Peninsular Desert can no longer be considered a subset of the Sonoran Desert-it is a separate regional desert with its own unique evolutionary history, ecological arena, and conservation value.


Figures

Figure 1
Figure 1
Summary geographic distributions of 12 vertebrate species or species-groups evaluated in this study; data for G–L are summarized from the literature (–9). (A) Peromyscus eremicus group, including P. eremicus (horizontal bars), P. eva (dark shading southern peninsula), P. fraterculus (diagonal bars), and P. merriami (dark shading western continental). P. eremicus was considered a single widespread species before recent phylogeographic analysis (10) that proposed western populations be designated as separate species, P. fraterculus. (B) Bailey's pocket mouse group, including Chaetodipus baileyi (dark shading) and C. rudinoris (light shading). C. baileyi was considered a single species before recent phylogeographic analysis (11) that proposed populations west of Colorado River be designated as a separate species, C. rudinoris. (C) Little desert pocket mouse, C. arenarius. (D) Merriam's, Dipodomys merriami, San José Island, D. insularis (i), and Margarita Island, D. margaritae (m) kangaroo rats. (E) Antelope ground squirrels, including Ammospermophilus leucurus (light shading), A. harrisii (dark shading), A. interpres (horizontal bars), and A. insularis (i). (F) Red-spotted toads, Bufo punctatus. (G) Desert woodrats, Neotoma lepida species-group, including N. devia (outlined) and N. lepida, with dashed line separating probable ranges of eastern and western phylogroups (4). (H) Le Conte's thrasher, Toxostoma lecontei group, considered a single species before phylogeographic analysis (5) that proposed southern peninsular populations be designated as a separate species, T. arenicola (dark shading). (I) Gopher snakes, Pituophis melanoleucus complex. (J) Side-blotched lizards, Uta stansburiana group. (K) Tree lizards, Urosaurus nigricaudus group (shaded). (L) Three species of rock lizards (9): Petrosaurus mearnsi (northernmost solid outline), P. repens (dashed outline), and P. thalassinus (southernmost solid outline). (M) Warm deserts of North America as depicted by Shreve (12): Sonoran, including peninsular (green), Mojave (yellow), Chihuahuan (red).
Figure 2
Figure 2
(A) Simplified Late Miocene to middle Pleistocene geological history of the Baja California peninsula and Sea of Cortéz (8, 23) depicting four postulated vicariance events between subtropical thornscrub (green) or desert (orange) biotas: southern gulf = Southern Miocene Vicariance between subtropical thornscrub biotas across the newly developing Gulf of California; Isthmus of La Paz = Isthmus of La Paz Pliocene Vicariance isolating the Cape Region from the rest of the peninsula by a trans-peninsular seaway; northern gulf = Northern Pliocene Vicariance isolating peninsular and continental warm desert biotas through northward transgression of the Sea of Cortéz into lowlands of southern California and Arizona; mid-peninsular = Middle Pleistocene Vicariance isolating northern and southern peninsular biotas across a trans-peninsular seaway in the central Vizcaino region. Areas of endemism resulting from vicariance events are as follows: PN, Peninsular North; PS, Peninsular South; CR, Peninsular Cape Region; CD, Continental Deserts; and ST, Continental Subtropical. Ma, million years ago. (B) Postulated areas and historical relationships among areas. The south-to-north opening of the Sea of Cortéz was likely a continuous event, having progressively bisected more southerly subtropical to more northerly desert biotas (23). Nevertheless, given different time frames (late Miocene vs. late Pliocene) and predicted affinities with different continental biotas (southern subtropical vs. northern desert), it is reasonable to postulate separate southern and northern peninsular–continental vicariance events.
Figure 3
Figure 3
Phylogeographic summaries: Left, cladograms; Right, maps. (A) Peromyscus eremicus group. (B) Chaetodipus baileyi group. (C) Chaetodipus arenarius. (D) Dipodomys merriami group. (E) Ammospermophilus. (F) Bufo punctatus. Capital letters after taxon names refer to areas as in Fig. 2B. Open circles in C and E signify localities at which both phylogroups occur. Trees shown here were produced with the neighbor-joining algorithm. Numbers along major branches refer to relative support for a clade out of 1,000 bootstrap pseudoreplications. Scale bars indicate 0.01 substitution per site.
Figure 4
Figure 4
Summary of postulated area relationships (see Fig. 2B) within 12 vertebrate species or species-groups inferred from distributions of mtDNA phylogroups (see Fig. 3): A–F from this study; G–L from the literature. Distinct phylogroup or taxon distributions are depicted as present (solid lines), missing (dotted lines), or unknown but postulated (dot–dash lines) in each area.

Comment in

References

    1. Good D A. Herp Monogr. 1994;8:180–202.
    1. Brown J H. Macroecology. Chicago: Univ. of Chicago Press; 1995.
    1. Riddle B R, Hafner D J. Global Ecology and Biogeography. 1999;8:433–441.
    1. Planz J V. Ph.D. dissertation. Denton: Univ. of North Texas; 1992.
    1. Zink R M, Blackwell R C, Rojas-Soto O. Condor. 1997;99:132–138.

Publication types

Associated data

LinkOut - more resources