. 2000 Dec 5;97(25):13778-83.
doi: 10.1073/pnas.250472097.

Impact of HIV-1 infection and highly active antiretroviral therapy on the kinetics of CD4+ and CD8+ T cell turnover in HIV-infected patients

Affiliations

Impact of HIV-1 infection and highly active antiretroviral therapy on the kinetics of CD4+ and CD8+ T cell turnover in HIV-infected patients

R A Lempicki et al. Proc Natl Acad Sci U S A. .

Abstract

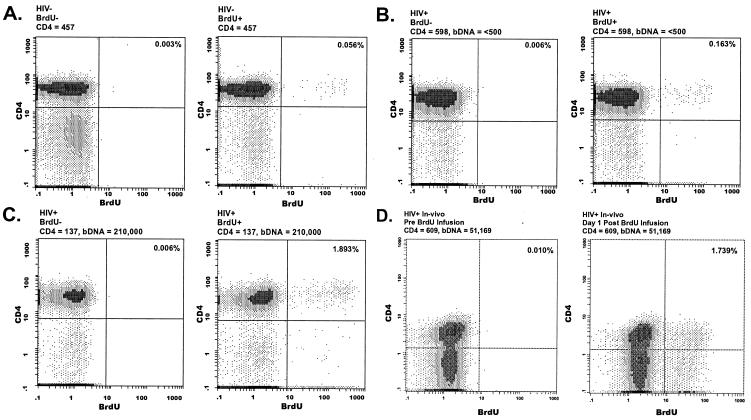
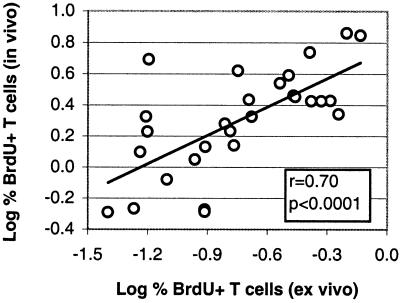
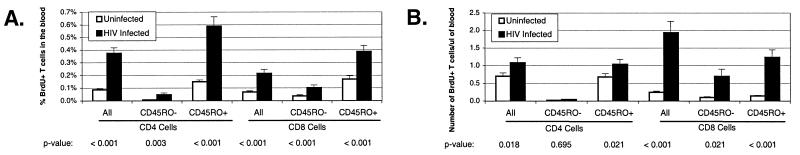
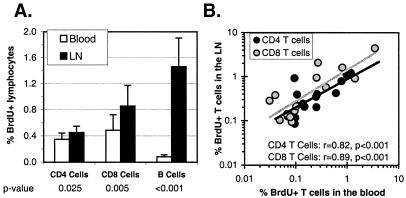
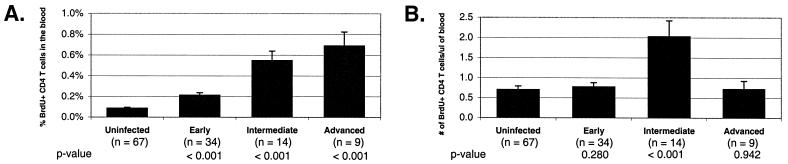
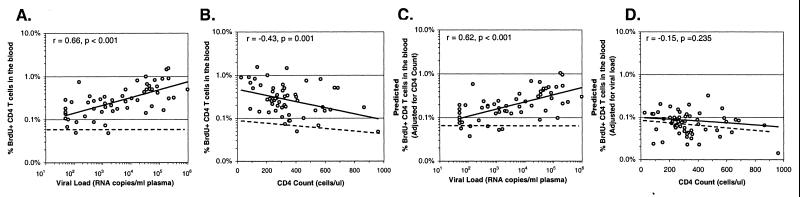
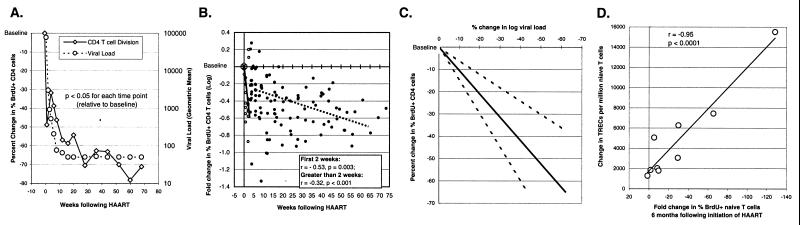
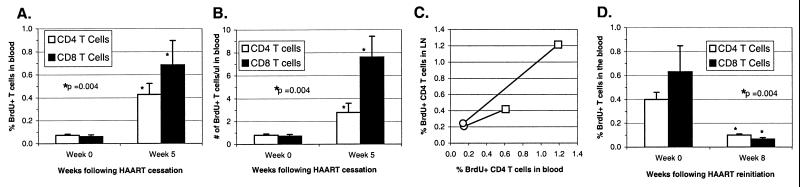
To evaluate the effects of HIV infection on T cell turnover, we examined levels of DNA synthesis in lymph node and peripheral blood mononuclear cell subsets by using ex vivo labeling with BrdUrd. Compared with healthy controls (n = 67), HIV-infected patients (n = 57) had significant increases in the number and fraction of dividing CD4(+) and CD8(+) T cells. Higher percentages of dividing CD4(+) and CD8(+) T cells were noted in patients with the higher viral burdens. No direct correlation was noted between rates of T cell turnover and CD4(+) T cell counts. Marked reductions in CD4(+) and CD8(+) T cell proliferation were seen in 11/11 patients 1-12 weeks after initiation of highly active antiretroviral therapy (HAART). These reductions persisted for the length of the study (16-72 weeks). Decreases in naive T cell proliferation correlated with increases in the levels of T cell receptor rearrangement excision circles. Division of CD4(+) and CD8(+) T cells increased dramatically in association with rapid increases in HIV-1 viral loads in 9/9 patients 5 weeks after termination of HAART and declined to pre-HAART-termination levels 8 weeks after reinitiation of therapy. These data are consistent with the hypothesis that HIV-1 infection induces a viral burden-related, global activation of the immune system, leading to increases in lymphocyte proliferation.


Figures

Figure 1
Figure 1
Detection of BrdUrd-labeled CD4+ cells. EDTA anticoagulated whole blood samples were drawn from an uninfected individual (A) and two patients infected with HIV-1, one with low viral load and high CD4+ count (B) and one with high viral load, low CD4 count (C), and assayed for ex vivo BrdUrd incorporation into CD4+ T cells. (AC) Whole blood was incubated with (Right) and without (Left) BrdUrd for 4 h at 37°C. (D) BrdUrd incorporation into CD4+ T cells of an individual with HIV-1 infection was determined before (Left) and 1 day after (Right) a 30-min infusion of BrdUrd (200 mg/m2). Cell surface staining and flow cytometric analysis of ex vivo- and in vivo-labeled cells were performed by using the same procedure.
Figure 2
Figure 2
In vivo BrdUrd incorporation in T cells correlates with ex vivo BrdUrd incorporation. Thirteen patients received a 30-min infusion of BrdUrd (200 mg/m2), and levels of peak in vivo BrdUrd incorporation into CD4+ and CD8+ T cells were compared with levels obtained from ex vivo BrdUrd staining performed immediately before the BrdUrd infusion. The correlation is shown for the combination of CD4+ (r = 0.70, P = 0.005) and CD8+ (r = 0.73, P = 0.003) T cells.
Figure 3
Figure 3
The mean fraction (A) and number (B) of proliferating CD4+ and CD8+ T cells in patients with HIV-1 infection (closed bars) compared with healthy controls (open bars). Ex vivo BrdUrd incorporation was determined in CD4+ or CD8+ T cells in 67 uninfected controls and 57 HIV-infected individuals (see Table 1). The number of dividing CD4+ and CD8+ T cells/μl of blood was determined by multiplying the T cell count by the fraction of BrdUrd-marked cells. Error bar = SEM. P values for significance (Mann–Whitney Rank Sum Test) between healthy controls and patients with HIV-1 infection are indicated below each graph.
Figure 4
Figure 4
CD4+, CD8+, and B lymphocyte proliferation rates in lymph node and peripheral blood (A). Correlation between rates of proliferation in peripheral blood and lymph node (B). The fractions of proliferating T cells in the blood and lymph nodes were compared in 15 patients with HIV-1 infection. Data for B cell division were obtained for 10 of these patients. Error bar = SEM. P values for significance also were determined by using Wilcoxon Signed Rank Tests.
Figure 5
Figure 5
Changes in the fraction (A) and the total number (B) of dividing CD4+ T cells in patients with HIV-1 infection as a function of disease progression. P values (Mann–Whitney Rank Sum Test) relative to uninfected controls are indicated. Patient groups are defined in Table 1. Error bar = SEM.
Figure 6
Figure 6
Relationships between fraction of dividing CD4+ T cells, viral load, and total CD4+ T cell count. The fraction of dividing CD4+ T cells correlates most strongly with viral load (A). This relationship was still maintained after normalizing CD4 count for each patient to 800 cells/μl (C). The fraction of dividing CD4+ cells also correlated inversely with CD4 count (B). This relationship was lost after normalizing viral load for each patient to 0 RNA copies/ml (D). A multiple linear regression analysis (see C and D) was conducted to determine whether viral load and CD4 count were independently predictive of CD4+ BrdUrd incorporation rates. The multiple linear regression equation was found to be: Log10(% CD4+BrdUrd+ cells) = [Log10(viral load) × 0.1652] − [(CD4 Count)*0.0003] − 3.0464; r = 0.67, P value (viral load) < 0.001, P value (CD4 count) = 0.13. The predicted CD4+ BrdUrd incorporation rate if CD4 counts were normalized to 800 cells/μl was calculated by the following equation: Log10(% CD4 + BrdUrd+ cells) − [(800 cells/μl − patient's CD4 count)*0.0003]; the predicted CD4+ BrdUrd incorporation rate if viral loads were normalized to 0 RNA copies/ml was calculated by the following equation: Log10(% CD4 + BrdUrd+ cells) − (patient's viral load)*0.1652. The dashed lines in A and C represent the average BrdUrd incorporation rate for CD4+ T cells from healthy controls. The dashed lines in B and D represent the best-fit line through the healthy control data points. Correlation coefficients and P values were determined by using Spearman Rank Order Correlation analysis.
Figure 7
Figure 7
The fraction of proliferating CD4+T cells decline after HAART. The incorporation of BrdUrd into CD4+T cells was monitored serially in 11 patients with HIV-1 infection after the initiation of HARRT. (A) The average percent decline from baseline measurements were determined for each of the indicated time points (◊) after initiation of HAART. Significance was determined by using the Wilcoxon Signed Rank Test. (B) For each patient, the fraction of dividing CD4+ T cells was normalized to the baseline value (day 0), transformed to the log10, and plotted against time. Spearman Rank Correlation coefficients and P values are shown for changes in the first 2 weeks (solid line; ○) and for the weeks thereafter (dashed lines; ●) after initiation of HAART. (C) Declines in CD4+ T cell proliferation parallel declines in viral load. Best-fit lines through the data points for percent change in percent BrdUrd+ CD4+ T cells versus percent change in log (RNA copies/ml plasma) were generated for each patient. The solid line represents the average change. The dotted lines define one standard deviation. (D) Changes in TREC levels in PBMCs (expressed in terms of TRECs per 106 CD45RO T cells) from nine patients before initiation and 6 months after initiation of HAART were compared with changes in the fraction of BrdUrd+ CD45RO T cells observed during the same time period.
Figure 8
Figure 8
Rates of BrdUrd incorporation into T cells of nine patients who had viral loads <50 RNA copies/ml plasma for longer than 1 year were determined pretermination and 5 weeks posttermination of HAART. Increases in the mean fraction (A) and number (B) of dividing CD4+ and CD8+ T cells were observed after cessation of HAART. (C) Similar increases in proliferation were observed in both the blood and lymph node in the two patients in whom both compartments were examined pretermination (○) and 5 weeks posttermination (□) of HAART. (D) The nine patients above each reinitiated HAART, and BrdUrd incorporation into T cells was determined pre-HAART and 8 weeks post-HAART. Error bars = SEM. P values were determined by using the Wilcoxon Signed Rank Test and reflect comparisons between week 0 and week 5 or 8.

References

    1. Lane H C, Depper J M, Greene W C, Whalen G, Waldmann T A, Fauci A S. N Engl J Med. 1985;313:79–84. - PubMed
    1. Wei X, Ghosh S K, Taylor M E, Johnson V A, Emini E A, Deutsch P, Lifson J D, Bonhoeffer S, Nowak M A, Hahn B H, et al. Nature (London) 1995;373:117–122. - PubMed
    1. Ho D D, Neumann A U, Perelson A S, Chen W, Leonard J M, Markowitz M. Nature (London) 1995;373:123–126. - PubMed
    1. Stein D S, Drusano G L. Antimicrob Agents Chemother. 1997;41:449–453. - PMC - PubMed
    1. Mosier D E. Nature (London) 1995;375:193–194. - PubMed

Publication types

MeSH terms

Substances