. 2000 Dec 5;97(25):13913-8.
doi: 10.1073/pnas.250478897.

Phototransduction in transgenic mice after targeted deletion of the rod transducin alpha -subunit

Affiliations

Phototransduction in transgenic mice after targeted deletion of the rod transducin alpha -subunit

P D Calvert et al. Proc Natl Acad Sci U S A. .

Erratum in

  • Proc Natl Acad Sci U S A 2001 Aug 28;98(18):10515

Abstract

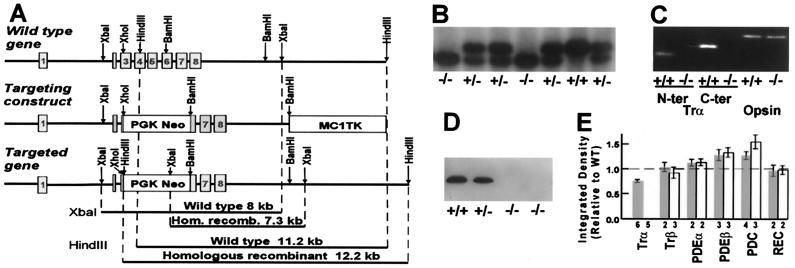
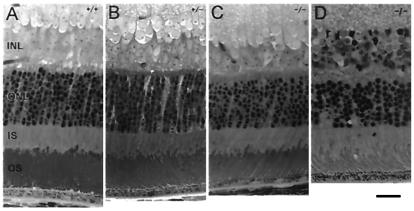
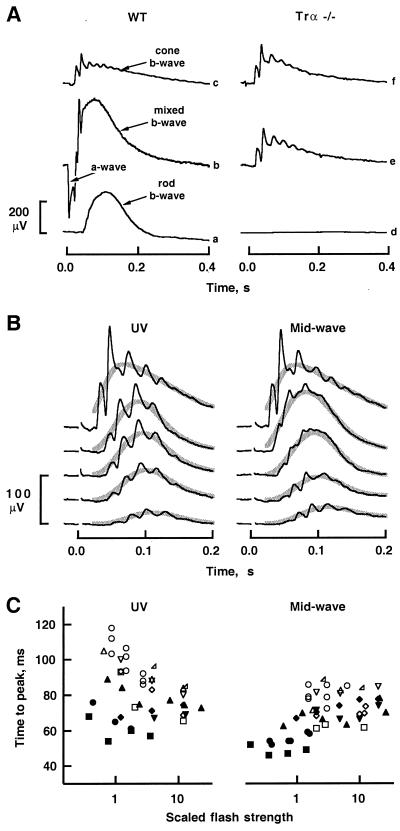
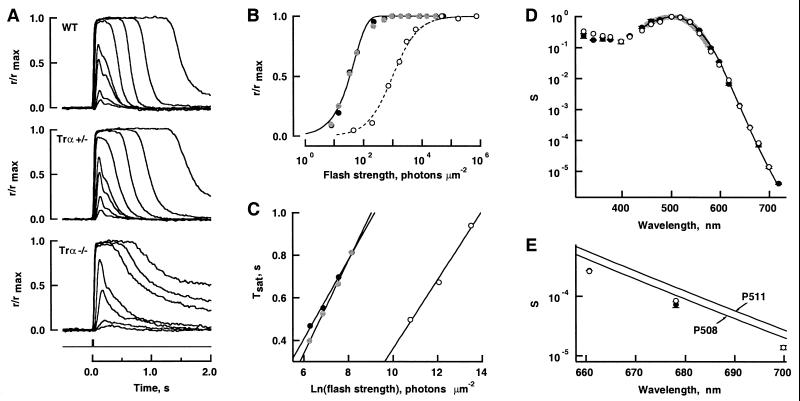
Retinal photoreceptors use the heterotrimeric G protein transducin to couple rhodopsin to a biochemical cascade that underlies the electrical photoresponse. Several isoforms of each transducin subunit are present in the retina. Although rods and cones seem to contain distinct transducin subunits, it is not known whether phototransduction in a given cell type depends strictly on a single form of each subunit. To approach this question, we have deleted the gene for the rod transducin alpha-subunit in mice. In hemizygous knockout mice, there was a small reduction in retinal transducin alpha-subunit content but retinal morphology and the physiology of single rods were largely normal. In homozygous knockout mice, a mild retinal degeneration occurred with age. Rod-driven components were absent from the electroretinogram, whereas cone-driven components were retained. Every photoreceptor examined by single-cell recording failed to respond to flashes, with one exception. The solitary responsive cell was insensitive, as expected for a cone, but had a rod-like spectral sensitivity and flash response kinetics that were slow, even for rods. These results indicate that most if not all rods use a single transducin type in phototransduction.


Figures

Figure 1
Figure 1
Molecular characterization of Trα −/− mice. (A) Gene-targeting strategy for knocking out Trα. Codons 63–207 of the wild-type (WT) Trα gene (top) were deleted by replacing the sequence between the XhoI site in exon 3 and the BamHI site in exon 6 with the phosphoglycerate kinase-driven neomycin resistance (PGK Neo) gene. The thymidine kinase gene MC1TK was attached to the 3′ end of the targeting construct for use in a negative-selection strategy. Diagnostic XbaI or HindIII restriction digestions distinguished the homologous recombinant (Hom. recomb.) from the WT gene. (B) Southern blot of XbaI digested DNA from tail samples of three litters of mice. Trα alleles from WT and Trα −/− appeared as 8- and 7.3-kb fragments, respectively. (C) Absence of Trα mRNA in Trα −/− retinas. Trα transcripts were not detected in Trα −/− mice by reverse transcription–PCR with primers specific for either the N or C terminus of the gene. The same procedure gave a positive result in littermate controls. Rod opsin expression was detected in both control and knockout mice by using rod opsin-specific PCR primers. Genotypes and PCR primers are shown at the bottom. (D) Lack of Trα protein in Trα −/− retinas. In the Western analysis, Trα was labeled by mab 4A in WT and Trα +/− mice but not in littermate-Trα −/− mice even after loading 50 times more homogenate onto the gel (far right). (E) Altered amounts of Trα, PDE, and phosducin in retinas of Trα +/− (gray bars) and Trα −/− (open bars) mice as determined by Western analysis. Error bars denote SEM. The numbers of determinations are listed below the histogram.
Figure 2
Figure 2
Retinal morphology at 4 weeks. (A) Trα +/+. (B) Trα +/−. (C) Trα −/−. (D) Trα −/− at 51 weeks. INL, inner nuclear layer; ONL, outer nuclear layer; IS, inner segments; OS, outer segments. (bar = 20 μm.)
Figure 3
Figure 3
ERGs of Trα −/− and WT mice. (A) Lack of rod-driven components in Trα −/− mice. Brief flashes of 513 nm, isomerizing 4.7 rhodopsin molecules per rod (traces a and d), or of white light isomerizing ≈530,000 rhodopsins per rod (traces b, c, e, and f), were delivered at time = 0 s. The white flashes also isomerized an estimated 0.087% of the UV-sensitive cone pigment and 1.2% of the mid-wavelength-sensitive cone pigment (16). Traces c and f were obtained in response to flashes superimposed on a 540-nm background light that isomerized ≈4,000 rhodopsins⋅rod−1⋅s−1. (B) Cone-driven b-waves elicited by UV (357 nm) and mid-wave (513 nm) flashes for a Trα −/− mouse in the absence of background light. Responses from 5–20 trials were averaged (black traces) and digitally filtered with a Gaussian filter (12 Hz, −3 dB; thick gray traces). Flashes delivered (bottom to top, in photons⋅μm−2 at the cornea): 1,200, 3,700, 6,280, and 11,700 at 357 nm and 4,300, 8,990, 22,100, 92,000, at 513 nm. Saturated responses (topmost in each column of responses) were elicited by bright, white flashes that isomerized ≈1.2% and ≈0.087% of the pigment in mid-wavelength- and UV-sensitive cones, respectively. (C) Dependence of cone b-wave time to peak on flash strength. UV (357) and mid-wave (513 nm) flashes were presented 2 s after the onset of the 540-nm background. Time to peak was taken as the interval between flash onset and the peak of the low-pass-filtered responses (see B) of WT (filled symbols) and Trα −/− (open symbols) mice. The flash intensities for each animal were scaled by the intensity that produced a 20% maximal response; thus, a scaled flash of unit intensity produced a b-wave whose amplitude was 20% of the saturated amplitude.
Figure 4
Figure 4
Flash responses of single cells. (A) Averaged responses of WT, Trα +/−, and Trα −/− cells; maximal amplitudes were 9, 13, and 13 pA, respectively. Flash monitor is shown by the Bottom trace. (B) The stimulus-response relation for flashes at 500 nm for WT (●), Trα +/− (gray symbols), and Trα −/− (○) cells in A. Some traces were omitted in A for clarity. WT and Trα +/− results were fit with (continuous lines): r/rmax = 1 − exp(−ki), where i was flash strength, k was ln(2)/i0, and i0 was the flash producing a half-maximal response. i0 was 36 and 35 photons⋅μm−2 for WT and Trα +/−, respectively. Trα −/− results were fit with the Michaelis–Menten relation (broken line): r/rmax = i/(i+ i0), where i0 = 1,000 photons⋅μm−2. (C) Recovery from response saturation. Saturation time (Tsat) was measured from midflash to 0.8 rmax on the falling phase of the saturated responses in A. A linear fit of Tsat to the natural logarithms of the flash intensities yielded the slopes: 0.186, 0.217, and 0.162 s for WT, Trα +/−, and Trα −/−, respectively. (D) Spectral sensitivities of four WT rods (●) and the responsive Trα −/− cell (○). The mean relative sensitivity and standard error at each wavelength were computed from the log S(λ) values. The fit of collected results with: S(λ) = {exp[70(0.88 − λmax/λ)] + exp[28.5(0.924 − λmax/λ)] + exp[−14.1(1.104 − λmax/λ)] + 0.655}−1 (thin black line; ref. 23), weighted by S(λ)−1, yielded a λmax of 503 nm. The difference spectrum of rhodopsin extracted from WT retinas had a maximum at 502 nm (thick gray line). (E) The spectral sensitivity from D on expanded axes. The two continuous lines show spectra predicted for pigments with maxima at 508 and 511 nm.

References

    1. Roof D, Makino C L. In: Principles and Practice of Ophthalmology. 2nd Ed. Alberts D, Jakobiec F, editors. Vol. 3. Philadelphia: Saunders; 2000. pp. 1624–1673.
    1. Lerea C L, Somers D E, Hurley J B, Klock I B, Bunt-Milam A H. Science. 1986;234:77–80. - PubMed
    1. Lerea C L, Bunt-Milam A H, Hurley J B. Neuron. 1989;3:367–376. - PubMed
    1. Fung B K-K, Lieberman B S, Lee R H. J Biol Chem. 1992;267:24782–24788. - PubMed
    1. Lee R H, Lieberman B S, Yamane H K, Bok D, Fung B K-K. J Biol Chem. 1992;267:24776–24781. - PubMed

Publication types