. 2000 Dec 5;97(25):13919-24.
doi: 10.1073/pnas.250483697.

What is a moment? "Cortical" sensory integration over a brief interval

Affiliations

What is a moment? "Cortical" sensory integration over a brief interval

J J Hopfield et al. Proc Natl Acad Sci U S A. .

Abstract

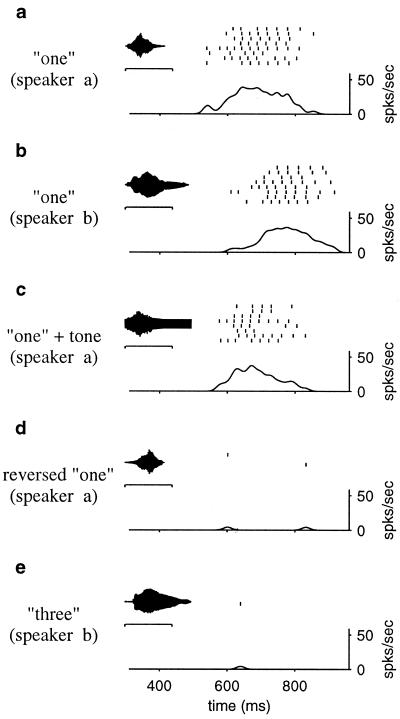
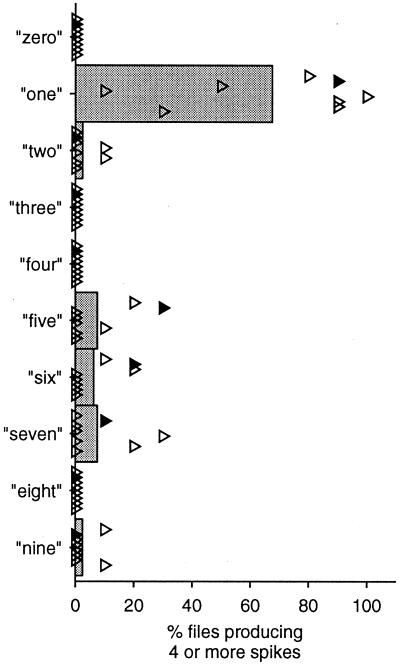
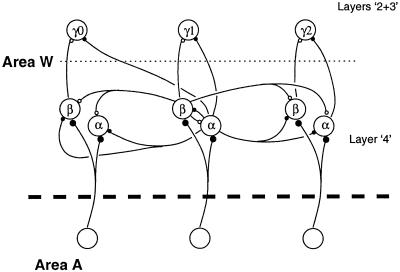
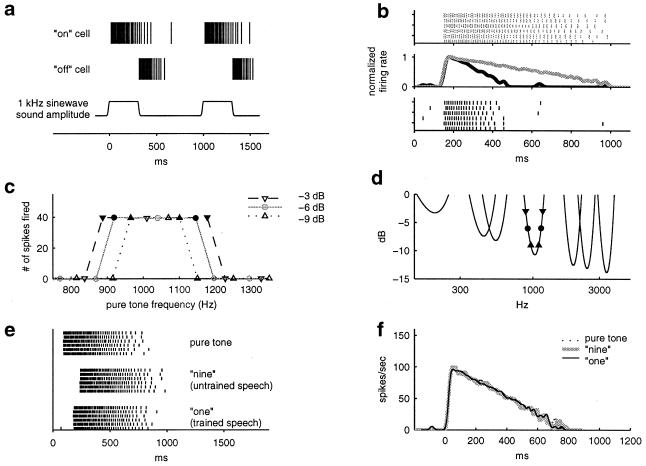
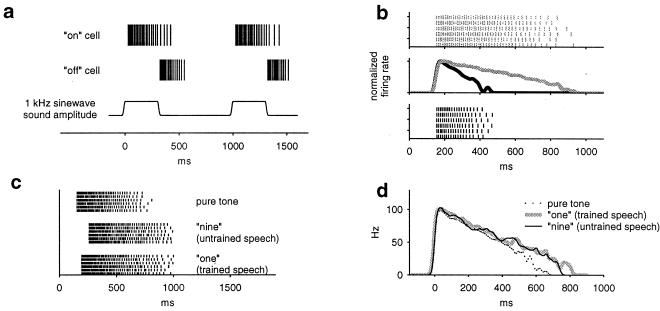
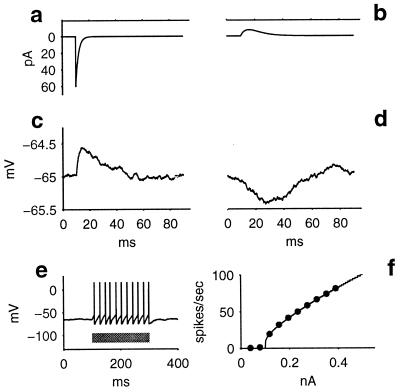
Recognition of complex temporal sequences is a general sensory problem that requires integration of information over time. We describe a very simple "organism" that performs this task, exemplified here by recognition of spoken monosyllables. The network's computation can be understood through the application of simple but generally unexploited principles describing neural activity. The organism is a network of very simple neurons and synapses; the experiments are simulations. The network's recognition capabilities are robust to variations across speakers, simple masking noises, and large variations in system parameters. The network principles underlying recognition of short temporal sequences are applied here to speech, but similar ideas can be applied to aspects of vision, touch, and olfaction. In this article, we describe only properties of the system that could be measured if it were a real biological organism. We delay publication of the principles behind the network's operation as an intellectual challenge: the essential principles of operation can be deduced based on the experimental results presented here alone. An interactive web site (http://neuron.princeton.edu/ approximately moment) is available to allow readers to design and carry out their own experiments on the organism.


Figures

Figure 1
Figure 1
Extracellularly recorded responses of a single γ-type neuron to five different acoustic waveforms. A noisy membrane current was added to every neuron in the simulation of the neuronal mathematics for the organism, to simulate the noise caused by other inputs that would always be present in a real biological system. Before the experiment, the network parameters were set by using only a single exemplar of “one” spoken by speaker a, plus single examples of nine other different patterns (each recognized by one of nine other γ-neurons, not shown here). (a) Spike rasters, aligned in time to the start of the acoustic waveform shown in the Inset, in response to eight different trials using an utterance of “one” from speaker a (not the training exemplar). Below the rasters is their corresponding peristimulus time histogram (PSTH), smoothed by a Gaussian with a standard deviation of 12 ms. The γ-cell begins spiking near the end of the word. Tick marks in the Inset correspond to 0 and 500 ms. (b) Same format as a, for an utterance of the word “one” from a different speaker (speaker b). (c) Same format as a for a “one” spoken by speaker a in the presence of a loud tone at 800 Hz. The waveforms are markedly different in a, b, and c, but the γ-cell responds to all. (d) Same format and utterance as in a, but the acoustic waveform has been reversed in time. (e) Same format as a, for an utterance by speaker b of the word “three.” Few or no spikes occurred in response to the waveforms of d and e. Other, similar-sounding words (for example, “wonder”) occasionally cause the cell to fire as well, indicating that these output cells are not completely specific but merely encode utterances quite sparsely.
Figure 2
Figure 2
Summary of responses of a single γ-cell to 10 spoken digits, “zero” through “nine” (speech data taken from the TI46 database, available from the National Institute of Standards and Technology). Each digit was spoken 10 times by eight different female speakers while the responses of the γ-cell were recorded. For the purpose of evaluating the cell's selectivity, each trial was classified as “responding” if the γ-cell fired four or more spikes and as “not responding” otherwise. Triangles indicate averages over different utterances by individual speakers, whereas the gray bars indicate data averaged over all utterances of all speakers. For five of the eight speakers, the cell's response is highly selective for the word “one.” The filled symbol indicates the speaker from which the single training utterance was taken.
Figure 3
Figure 3
Schematic neuroanatomy for area W and its input. The thick dashed line separates area A from area W; the thin dotted line separates layers 2 + 3 from layer 4 in area W. Small filled circles indicate excitatory connections, whereas small open circles indicate inhibitory connections. The connections of a typical α-cell and a typical β-cell, both shown in the center, are sketched. In the simulations, area W is small, containing 325 neurons of each α- and β-type, and a given cell makes synapses on 15–30% of these cells. Our simulation contains 10 different γ-cells, each selective for a different temporal pattern. Each γ-cell receives inputs from 30–80 cells of each type, α and β.
Figure 4
Figure 4
(a) Spike rasters for a typical onset cell and a typical offset cell in response to two pure sine wave tone stimuli, as indicated at the bottom of a. The beginning and end of each tone are slightly smoothed as shown to minimize the generation of spurious frequencies by the sharp transient. (b) Responses of two different onset cells to six different trials of a pure tone onset. One cell is shown in gray, the other in black (top and bottom of b). Middle shows PSTHs of the responses of the two cells. (c) The number of spikes generated in response to “step” sine wave inputs (as shown in a) as a function of sine wave frequency, plotted for three different sine wave amplitudes. Signal power is measured in decibels relative to an arbitrary reference power. As long as the frequency is within a range that depends on signal power (larger range for larger signal powers), the number of spikes generated varies little. Filled symbols indicate the boundary between presence and absence of a robust spiking response. (d) Parabolic fits to measurements of threshold power vs. frequency, for seven different onset cells. Each parabola represents a single cell. Filled symbols correspond to filled symbols in c. (e) The response of an onset cell to three different stimuli, a pure tone onset, the word “one”, and the word “nine.” (f) Histograms of the responses of e time-shifted into best alignment. When shifted into alignment, there is no apparent difference between these histograms or between the spike rasters of the three sounds.
Figure 5
Figure 5
Responses of layer 4 area W cells. (a) The spike rasters for a typical onset cell and a typical offset cell in response to sine wave pulses (format as in Fig. 4a). (b) Responses of two different onset cells to six different trials with the same pure tone onset (format as in Fig. 4b). (c) The response of an onset cell to three different stimuli, a pure-tone step, the word “one,” and the word “nine” (format as in Fig. 4e). (d) Histograms of the responses of e shifted into a common response onset time (format as in Fig. 4f).
Figure 6
Figure 6
Whole-cell recordings from α- and β-cells in layer 4. (ad): A minimal stimulation protocol was used to observe synaptic responses caused by the activation of a single axon afferent to the recorded cell. (a) Excitatory postsynaptic current measured in a β-cell under voltage-clamp conditions. (b) Inhibitory postsynaptic current measured in an α-cell. (c) Excitatory postsynaptic potentials measured in the same cell as in a. Resting state here corresponds to the cell's resting membrane potential, −65 mV. (Because noise is present in all real biological systems, here and in all other simulations, independent white Gaussian noise with SD = 0.2 mV was added to the neuron's membrane potential at each 0.1-ms timestep.) The trace shown is the average of 1,000 repeats. (d) Inhibitory postsynaptic potentials measured in the same cell as in b. (e) Spiking response to an above-threshold current step, showing no spike-frequency adaptation. Gray bar indicates the time during which current was injected. (f) Firing rate of an α-cell as a function of input current. Points are the experimental measurements, and the solid line is a calculated fit to these points, based on a leaky integrate-and-fire model of the cell.

Publication types

LinkOut - more resources