. 2000 Dec;66(12):5448-56.
doi: 10.1128/AEM.66.12.5448-5456.2000.

Biogeography and degree of endemicity of fluorescent Pseudomonas strains in soil

Affiliations

Biogeography and degree of endemicity of fluorescent Pseudomonas strains in soil

J C Cho et al. Appl Environ Microbiol. 2000 Dec.

Abstract

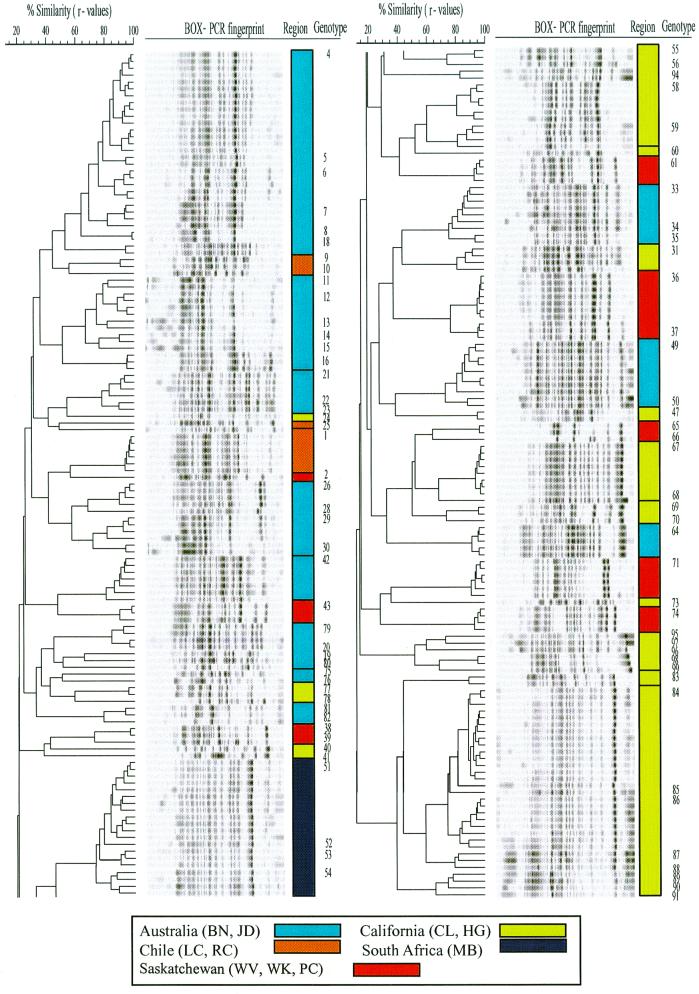
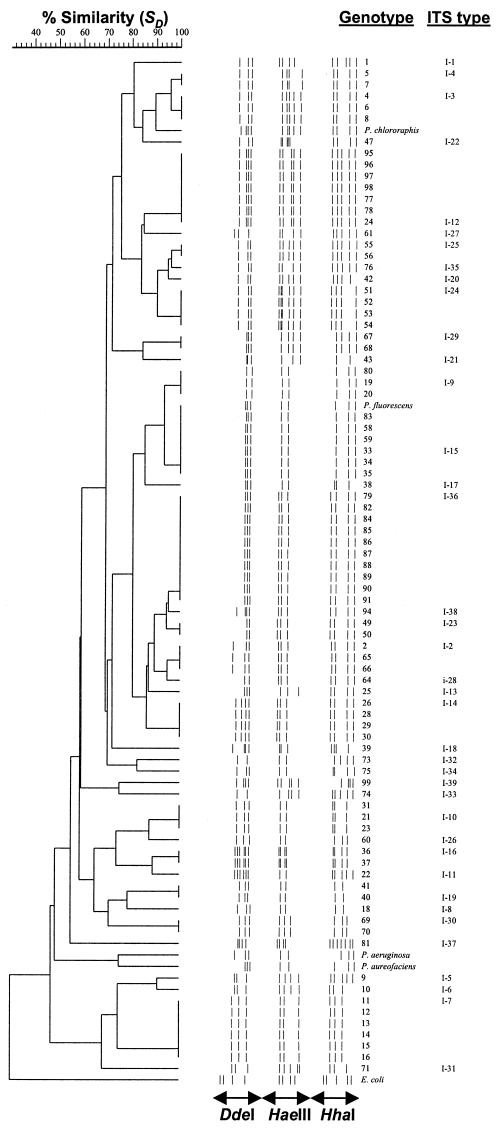
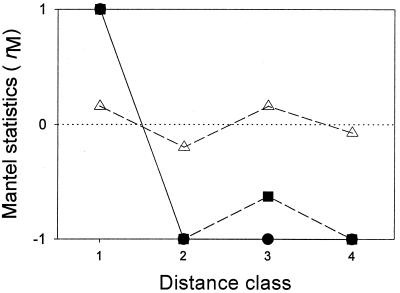
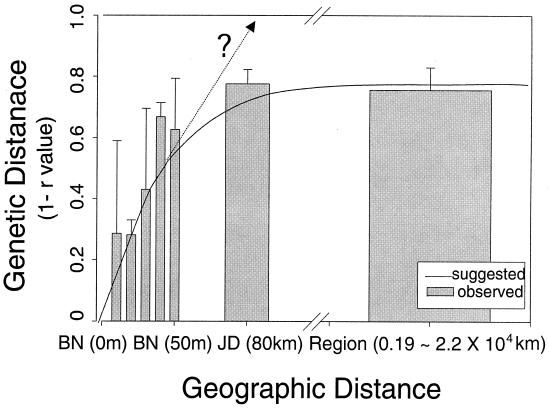
Fluorescent Pseudomonas strains were isolated from 38 undisturbed pristine soil samples from 10 sites on four continents. A total of 248 isolates were confirmed as Pseudomonas sensu stricto by fluorescent pigment production and group-specific 16S ribosomal DNA (rDNA) primers. These isolates were analyzed by three molecular typing methods with different levels of resolution: 16S rDNA restriction analysis (ARDRA), 16S-23S rDNA intergenic spacer-restriction fragment length polymorphism (ITS-RFLP) analysis, and repetitive extragenic palindromic PCR genomic fingerprinting with a BOX primer set (BOX-PCR). All isolates showed very similar ARDRA patterns, as expected. Some ITS-RFLP types were also found at every geographic scale, although some ITS-RFLP types were unique to the site of origin, indicating weak endemicity at this level of resolution. Using a similarity value of 0.8 or more after cluster analysis of BOX-PCR fingerprinting patterns to define the same genotypes, we identified 85 unique fluorescent Pseudomonas genotypes in our collection. There were no overlapping genotypes between sites as well as continental regions, indicating strict site endemism. The genetic distance between isolates as determined by degree of dissimilarity in BOX-PCR patterns was meaningfully correlated to the geographic distance between the isolates' sites of origin. Also, a significant positive spatial autocorrelation of the distribution of the genotypes was observed among distances of <197 km, and significant negative autocorrelation was observed between regions. Hence, strong endemicity of fluorescent Pseudomonas genotypes was observed, suggesting that these heterotrophic soil bacteria are not globally mixed.


Figures

FIG. 1
FIG. 1
(A) Microtiter plate under UV light showing production of fluorescent pigments by fluorescent Pseudomonas isolates. (B) PCR amplification product from fluorescent Pseudomonas isolates with fluorescent-Pseudomonas-specific PCR primers Ps-for and Ps-rev. Lane S, 100-bp DNA size marker (Gibco-BRL); lane 1, P. aeruginosa; lanes 2, 3, 4, and 5; fluorescent Pseudomonas isolates C-RC-3-403, S-WV-I-406, A-BN-I-405, and A-BN-5-408, respectively; lanes 6 and 7, nonfluorescent isolates; lane 8, E. coli DH5α.
FIG. 2
FIG. 2
Product moment-UPGMA cluster analysis of BOX-PCR fingerprints of fluorescent Pseudomonas isolates. On the scale, r values are expressed as percentages.
FIG. 3
FIG. 3
Gel electrophoresis showing length polymorphism of PCR-amplified 16S-23S rDNA ITS regions from fluorescent Pseudomonas genotypes (A) and restriction patterns of PCR-amplified 16S-23S rDNA ITS regions digested with DdeI (B), HaeIII (C), and HhaI (D). Lane S, 100-bp DNA size marker (Gibco-BRL); lanes 1, 2, 3, 4, 5, 6, 7, and 8, genotypes 19, 20, 11, 12, 4, 28, 27, and 78, respectively.
FIG. 4
FIG. 4
Dice-UPGMA cluster analysis of combined DdeI, HaeIII, and HhaI restriction patterns of amplified 16S-23S rDNA ITS regions of fluorescent Pseudomonas genotypes. The individual RFLPs shown are derived from the actual restriction fragments. Each ITS type is indicated by a code.
FIG. 5
FIG. 5
Mantel correlograms for the spatial autocorrelation analysis of fluorescent Pseudomonas (circles, genotype; squares, ITS-RFLP type; triangles, ARDRA type). Standard Mantel statistics (rM) are plotted against the distance classes. Closed symbols represent significant autocorrelation at the α = 0.05 level.
FIG. 6
FIG. 6
Relationship between geographic distance and genetic distance. Geographic distances are based on the distance from the reference site BN (transect sample 0). Error bars indicate the range of the values of genetic distance. The question mark indicates that genetic distance may continue to diverge if the method's resolution did not saturate.

References

    1. Baas-Becking L G M. Geobiologie of Inleiding Tot de Milieukunde. The Hague, The Netherlands: W. P. van Stockum & Zoon N. V.; 1934.
    1. Beeder J, Nielsen R K, Rosnes J T, Torsvik T, Lien T. Archaeoglobus fulgidus isolated from hot North Sea oil field waters. Appl Environ Microbiol. 1994;60:1227–1234. - PMC - PubMed
    1. Beijerinck M W. De infusies en de ontdekking der backteriën, Jaarboek van de Koninklijke Akademie v. Wetenschappen. Amsterdam, The Netherlands: Müller; 1913.
    1. Bourque S N, Valero J R, Lavoie M C, Levesque R C. Comparative analysis of the 16S to 23S ribosomal intergenic spacer sequences of Bacillus thuringiensis strains and subspecies and of closely related species. Appl Environ Microbiol. 1995;61:1623–1626. - PMC - PubMed
    1. Castenholz R W. Endemism and biodiversity of thermophilic cyanobacteria. Nova Hedwigia Beiheft. 1996;112:33–47.

Publication types

LinkOut - more resources