. 2000 Dec;116(6):825-44.
doi: 10.1085/jgp.116.6.825.

Anion permeation in Ca(2+)-activated Cl(-) channels

Affiliations

Anion permeation in Ca(2+)-activated Cl(-) channels

Z Qu et al. J Gen Physiol. 2000 Dec.

Abstract

Ca(2+)-activated Cl channels (Cl(Ca)Cs) are an important class of anion channels that are opened by increases in cytosolic [Ca(2+)]. Here, we examine the mechanisms of anion permeation through Cl(Ca)Cs from Xenopus oocytes in excised inside-out and outside-out patches. Cl(Ca)Cs exhibited moderate selectivity for Cl over Na: P(Na)/P(Cl) = 0.1. The apparent affinity of Cl(Ca)Cs for Cl was low: K(d) = 73 mM. The channel had an estimated pore diameter >0.6 nm. The relative permeabilities measured under bi-ionic conditions by changes in E(rev) were as follows: C(CN)(3) > SCN > N(CN)(2) > ClO(4) > I > N(3) > Br > Cl > formate > HCO(3) > acetate = F > gluconate. The conductance sequence was as follows: N(3) > Br > Cl > N(CN)(2) > I > SCN > COOH > ClO(4) > acetate > HCO(3) = C(CN)(3) > gluconate. Permeant anions block in a voltage-dependent manner with the following affinities: C(CN)(3) > SCN = ClO(4) > N(CN)(2) > I > N(3) > Br > HCO(3) > Cl > gluconate > formate > acetate. Although these data suggest that anionic selectivity is determined by ionic hydration energy, other factors contribute, because the energy barrier for permeation is exponentially related to anion hydration energy. Cl(Ca)Cs exhibit weak anomalous mole fraction behavior, implying that the channel may be a multi-ion pore, but that ions interact weakly in the pore. The affinity of the channel for Ca(2+) depended on the permeant anion at low [Ca(2+)] (100-500 nM). Apparently, occupancy of the pore by a permeant anion increased the affinity of the channel for Ca(2+). The current was strongly dependent on pH. Increasing pH on the cytoplasmic side decreased the inward current, whereas increasing pH on the external side decreased the outward current. In both cases, the apparent pKa was voltage-dependent with apparent pKa at 0 mV = approximately 9.2. The channel may be blocked by OH(-) ions, or protons may titrate a site in the pore necessary for ion permeation. These data demonstrate that the permeation properties of Cl(Ca)Cs are different from those of CFTR or ClC-1, and provide insights into the nature of the Cl(Ca)C pore.


Figures
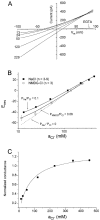
Figure 1
Figure 1
Sodium permeability and Cl affinity of ICl.Ca. An inside-out excised patch from a Xenopus oocyte was exposed to different cytoplasmic [NaCl] concentrations and the I–V relationship determined by 250-ms duration voltage ramp from −100 to +100 mV. (A) I–V curves. The external (pipet) solution contained 150 mM NaCl, 10 mM HEPES, 0.1 mM CaCl2, pH 7.2. The cytoplasmic (bath) solution contained the same solution except that the NaCl concentration was varied. The osmolarity of each solution was adjusted to 665 mOsM by addition of sucrose, except for the 350- and 460-mM solutions, which had higher osmolarities and contained no sucrose. The Cl activities (aCl) measured by Cl-sensitive electrodes are indicated at the left end of each I–V curve. The I–V curve labeled EGTA was obtained in symmetrical 150-mM NaCl solutions, except that Ca2+ in the cytoplasmic solution was omitted and 10 mM Na2EGTA, pH 7.2, was added. (B) Change in Erev as a function of aCl. The reversal potentials from experiments shown in A were corrected for liquid junction potentials. (Solid squares) NaCl solutions. Each data point is the mean of three to nine patches. The heavy solid line is calculated from the Goldman-Hodgkin-Katz equation (ΔErev = 25.7 · ln[(Nao +Cli · PCl/PNa)/(Nai + Clo · PCl/PNa)]) with PNa/PCl = 0.1. (Open squares) NMDG-Cl solutions; n = 3. Thin line is calculated from the Goldman-Hodgkin-Katz equation with PNMDG/PCl = 0.06. The dashed line is calculated assuming that the channel is selectively permeable only to Cl. (C) Affinity of the channel for Cl. The chord conductance was measured from I–V curves between Erev and Erev − 50 mV and plotted versus aCl. The line is a fit to the equation G = Gmax · aCl / K d + aCl, with an apparent K d for Cl of 73 mM.
Figure 2
Figure 2
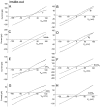
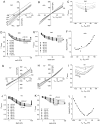
I–V relationships of ICl.Ca in inside-out patches with different cytoplasmic anions. The external solution contained 150 mM NaCl, 10 mM TES, pH 7.2, and 0.1 mM CaCl2. The cytoplasmic solution was shifted between this solution (unlabeled traces) and 150 mM NaX, 10 mM TES, pH 7.2, 0.1 mM CaCl2, where X is the substitute anion (labeled traces). The traces have not been corrected for liquid junction potentials. (A) Fluoride; (B) bromide; (C) iodide; (D) azide; (E) perchlorate; (F) dicyanamide; (G) thiocyanate; and (H) tricyanomethanide (potassium salt). The I–V curves were obtained by voltage ramps from −100 to +100 mV.
Figure 3
Figure 3
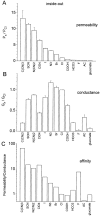
Anionic selectivity of ICl.Ca in inside-out patches. (A) Relative permeabilities. The Erevs corrected for liquid junction potential were obtained from experiments such as those shown in Fig. 2. These values were used to calculate relative permeabilities from the Goldman-Hodgkin-Katz equation (see materials and methods). (B) Relative conductance was determined by measuring the conductance with the substitute anion between Erev and Erev − 50 mV, and dividing this value by the conductance with symmetrical Cl. (C) Relative affinities. Relative affinities of the channel for the ions were determined by dividing the relative permeability by the relative conductance. n = 3–5 patches per substitute anion.
Figure 4
Figure 4
I–V relationships of ICl.Ca in outside-out patches with different external anions. The conditions were the same as Fig. 2, except that the patch was outside-out. (A) Fluoride; (B) bromide; (C) azide; (D) perchlorate; (E) thiocyanate; and (F) tricyanomethanide.
Figure 5
Figure 5
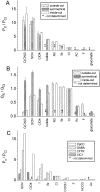
Comparison of permeabilities and conductances. (A) Relative permeabilities. (B) Relative conductances. (Open bars) Inside-out patches with changes in cytoplasmic solution (n = 3–5). (Cross-hatched bars) Outside-out patches with changes in external solution (n = 3–4). (Closed bars) Inside-out patches with substitute anion on both sides of the membrane was compared with Cl on the cytoplasmic side (n = 3–6). (C) Comparison of Px/PCl in different anion channels. ClCaC (open bars; data from this paper); GABAA receptor (cross-hatched bars; data from Bormann et al. 1987); CFTR (slant-hatched bars; data from Linsdell and Hanrahan 1998); and ClC-1 (closed bar; data from Rychkov et al. 1998).
Figure 6
Figure 6
Analysis of anion permeation through ClCaC channels. (A) The relative energy barrier height (Δ(ΔG)barrier) was calculated from the permeabilities relative to C(CN)3 in Fig. 5 using . Δ(ΔG)barrier was plotted versus the reciprocal of the ionic radius of the anion after applying the Lattimer correction (Smith et al. 1999). (Closed squares) Inside-out patches; (open circles) outside-out patches. The line is the best fit to the data points excluding gluconate, acetate, bicarbonate, and formate. (B) Calculation of the effective dielectric constant of the pore. The relative Born hydration energy in water (heavy solid line) was calculated from with ɛ = 80 (water). The line (Δ(ΔG)barrier) through the data points is from A. Relative solvation energy (thin line) was calculated by subtracting the fit to the data points from the heavy line. (C) Δ(ΔG)barrier versus measured free energies of hydration. Hydration free energies were obtained from Marcus 1997 or were extrapolated from potentiometric measurements (Smith et al. 1999). (D) Relative permeabilities versus hydration free energy.
Figure 7
Figure 7
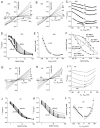
ICl.Ca block by C(CN)3. (A–E) Outside-out patch with C(CN)3 on the extracellular face. (G–L) Inside-out patch with C(CN)3 on the cytoplasmic side. The bath solutions contained 10 mM TES, pH 7.2, 0.1 mM CaCl2, and 150-mM mixtures of NaCl and KC(CN)3. The pipet contained the same solution with 150 mM NaCl. The patch was voltage-clamped with a 250-ms duration voltage ramp from −100 to +100 mV. (A) I–V relationships in outside-out patches with the following external mol% C(CN)3 (the balance being Cl) as marked: 0, 0.1, 0.2, 0.5, 1, 10, and 100. The line marked “SO4” is the I–V curve obtained with Cl replaced with SO4 on the external side to evaluate leak. (B) The I–V curves in A were replotted versus the driving force (Vm− Erev) for each anion mixture. (C) Voltage-dependent block of ICl.Ca by C(CN)3. (Heavy lines) Each curve in B was divided by the curve obtained in 100 mol% Cl. (Light lines) Fit of the data to (see text). (D) Concentration- and voltage-dependent block of ICl.Ca. The data in C were replotted for various potentials as a function of mol% C(CN)3. The data were fitted to the logistic equation: I/IC(CN)3 = 0 = Imin + {(Imax – Imin) / 1 +([C(CN)3] /K d)n} (solid lines). (E) Apparent K d of extracellular C(CN)3 as a function of voltage. The apparent K d at each voltage was determined from the fits in D in four separate experiments and averaged. (F) Inhibition of the current in both inside-out and outside-out patches as a function of mol% C(CN)3. The current was measured at +80 and −80 mV of driving force. The current relative to that in 100% Cl was plotted versus [C(CN)3]. (Squares) Outside-out patches; (circles) inside-out patches; (open symbols) −80 mV; and (closed symbols) +80 mV. (G) I–V relationships for inside-out patches with the following cytoplasmic mol% C(CN)3 (the balance being Cl) as marked: 0, 1, 2, 5, 10, 25, and 100. (H) The I–V curves in G were replotted versus the driving force (Vm− Erev) for each anion mixture. (I) Voltage-dependent block of ICl.Ca by C(CN)3. Each curve in H was divided by the curve obtained in 100 mol% Cl. (J and K) Concentration- and voltage-dependent block of ICl.Ca. The data in I were replotted for various potentials as a function of mol% C(CN)3. The data were fitted to the logistic equation (solid lines). (L) Apparent K d of cytoplasmic C(CN)3 as a function of voltage. The apparent K d at each voltage was determined from the fits in J and K for four separate experiments and averaged.
Figure 8
Figure 8
ICl.Ca block by SCN. (A–F) Outside-out patch with SCN on the extracellular face. (G–L) Inside-out patch with SCN on the cytoplasmic side. Bath solutions contained 10 mM TES pH 7.2, 0.1 mM CaCl2, and 150-mM mixtures of NaCl and NaSCN. The pipet contained the same solution with 150 mM NaCl. The patch was voltage-clamped with a 250-ms duration voltage ramp from −100 to +100 mV. (A) I–V relationships with the following external mol% SCN (the balance being Cl) as marked: 0, 1, 2, 5, 10, 25, and 100. (B) The I–V curves in A were replotted versus the driving force (Vm− Erev) for each anion mixture. (C) Voltage-dependent block of ICl.Ca by external SCN. Each curve in B was divided by the curve obtained in 100 mol% Cl. (D and E) Concentration- and voltage-dependent block of ICl.Ca. The data in C were replotted for various potentials as a function of mol% SCN. The data were fitted to the logistic equation (solid lines). In D, the data points at 100 mol% SCN were ignored in fitting the curves. This experiment is representative of three experiments. (F) Apparent K d of extracellular SCN as a function of voltage. The apparent K d at each voltage was determined from the fits in D and E. (G) I–V relationships with the following cytoplasmic mol% SCN (the balance being Cl) as marked: 0, 1, 2, 5, 10, 25, and 100. (H) The I–V curves in G were replotted versus the driving force (Vm− Erev) for each anion mixture. (I) Voltage-dependent block of ICl.Ca by cytoplasmic SCN. Each curve in H was divided by the curve obtained in 100 mol% Cl. (J and K) Concentration- and voltage-dependent block of ICl.Ca. The data in I were replotted for various potentials as a function of mol% SCN. The data were fitted to the logistic equation (solid lines). In J, the data points at 100 mol% SCN were ignored in fitting the curves. This experiment is representative of five experiments. (L) Apparent K d of cytoplasmic SCN as a function of voltage. The apparent K d at each voltage was determined from the fits in J and K.
Figure 9
Figure 9
Anomalous mole fraction behavior of ClCaCs. (A) Dependence of Erev on mol% C(CN)3 or SCN. The Erevs corrected for liquid junction potential obtained from experiments such as those in Fig. 7 and Fig. 8 were plotted versus mol% of the substitute anion. (Open symbols) SCN, n = 5; (closed symbols) C(CN)3, n = 4. (Solid line) Goldman-Hodgkin-Katz equation with PSCN/PCl = 8. (B) Dependence of permeability ratio on mol% of SCN or C(CN)3. Px/PCl was calculated from the data in A from the form of the Goldman-Hodgkin-Katz equation: Px/PCl = [Clo · (exp (F/RT · ΔErev) – 1) / Xi] +1, where Clo = 150 mM and Xi is the concentration of the substitute anion. (C) Dependence of slope conductance on driving force at different mol% SCN. The slope conductance was determined by calculating the slope of the I–V curve of an inside-out patch like the one in Fig. 8 using a 20-mV moving window. The resulting curves were smoothed by the FFT smoothing algorithm in Origin and the slope conductance was plotted versus the driving force for different mol% SCN (labels to left of curves). (D) Slope conductance versus mol% SCN. The slope conductance for four different voltages in C was plotted versus mol% SCN. The curves show a minimum slope conductance at 10–25 mol% SCN.
Figure 10
Figure 10
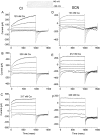
Current traces of ICl.Ca in low free [Ca2+] with Cl or SCN as permeant anion. All traces are from the same patch. Inside-out excised patches were voltage-clamped in symmetrical 150 mM NaCl (A–C) or with 150 mM NaSCN on the cytoplasmic side and 150 mM NaCl on the external side (D–F). The solutions also contained 10 mM TES, pH 7.2, and 10 mM EGTA plus Ca-EGTA, as described in materials and methods, to adjust the free [Ca2+] to the concentrations indicated on the cytoplasmic side. Ca2+ concentrations were measured by Fura-2 fluorescence. The patches were clamped from a holding potential of 0 mV to potentials between +140 and −100 mV for 1 s, followed by a 500-ms pulse to −100 mV. These traces are typical of four experiments.
Figure 11
Figure 11
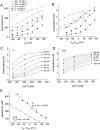
Calcium dependence of ICl.Ca with Cl or SCN as permeant anion. (A) Tail currents versus voltage. The instantaneous tail currents at –100 mV in Fig. 10 were plotted versus voltage for each condition (open symbols, SCN; closed symbols, Cl; [Ca2+] as indicated). (B) Conductance versus voltage. The conductance of the traces in Fig. 10 was determined by measuring the amplitudes of the instantaneous tail currents at −100 mV and dividing by the driving force (Vm− Erev). Erev was shifted +58 mV in SCN compared with Cl. (C) Conductance versus free [Ca2+] at various potentials with Cl as permeant anion. The data were fitted to the Boltzmann equation: G = Gmin − [(Gmax − Gmin) / 1 + e([Ca]K d )/s], where Gmax and Gmin are the maximum and minimum conductances, respectively, and s is the slope factor. Gmax was fixed at 4.46 nS for Cl and 4.54 nS for SCN, and Gmin was fixed at 0. Gmax was chosen by preliminary fitting sessions using the data from the most positive potentials and allowing all variables to float. Our previous extensive study on the voltage dependence of ICl.Ca (Kuruma and Hartzell 2000) justified using the same Gmax for all voltages. Because of problems with rundown of ICl.Ca in excised patches (Kuruma and Hartzell 2000), we were able to test only a limited number of [Ca2+] before rundown exceeded 10%. This limited the number of data points we had available for fitting. (D) Conductance versus free [Ca2+] at various potentials with SCN as the permeant anion. (E) Apparent K d for Ca2+ is different in the presence of Cl and SCN. The apparent K d was extracted from the Boltzmann fits in C and D and plotted versus membrane potential. These data are typical of four experiments.
Figure 12
Figure 12
Dependence of ICl.Ca on cytoplasmic pH. An inside-out patch was exposed to bath solutions composed of 150 mM NaCl, 0.1 mM CaCl2, and 10 mM HEPES, adjusted to pH between 6.3 and 9.5 with NaOH. The pipet contained the same solution at pH 7.0. The patch was voltage-clamped by a ramp from −120 to +120 mV. (A) I–V relationship for pH 7.0, 7.4, 7.75, 8.13, 8.45, 8.88, 9.2, and 9.5. (B) Amplitude of the current at +100 mV (circles) and −100 mV (squares) for the traces shown in A and also pH 6.3. (C) Slope conductance measured between −100 and −120 mV (closed squares) or between +100 and +120 mV (open circles). (D) Voltage dependence of pH block. The currents at each pH in A were divided by the current at pH 7.0 and plotted versus membrane potential. (E) pH- and voltage-dependent block of ICl.Ca. The data in D was replotted versus pH. (F) Apparent pKa versus Vm. The apparent pKa of current block was determined from the fits to the data in E and plotted versus membrane potential. This experiment is typical of eight experiments.
Figure 13
Figure 13
Dependence of ICl.Ca on external pH. An outside-out patch was exposed to bath solutions composed of 150 mM NaCl, 0.1 mM CaCl2, 10 mM HEPES, adjusted to pH between 7.0 and 9.5 with NaOH. The pipet contained the same solution at pH 7.0. The patch was voltage-clamped by a ramp from −120 to +120 mV. (A) I–V relationship for pH 7.0, 7.4, 8, 8.5, 9, and 9.5. (B) Voltage dependence of pH block. The currents at each pH in A were divided by the current at pH 7.0 and plotted versus membrane potential. (C) pH- and voltage-dependent block of ICl.Ca. The data in B was replotted versus pH. (D) Apparent pKa versus Vm. The apparent pKa of current block was determined from the fits to the data in C and plotted versus membrane potential. This experiment is one of two experiments in outside-out configuration and four inside-out experiments in which the solution inside the patch pipet was changed.

Similar articles

Cited by

References

    1. Almers W., McCleskey E.W. Non-selective conductance in calcium channels of frog musclecalcium selectivity in a single-file pore. J. Physiol. 1984;353:585–608. - PMC - PubMed
    1. Amédéé T., Large W.A., Wang Q. Characteristics of chloride currents activated by noradrenaline in rabbit ear artery cells. J. Physiol. 1990;428:501–516. - PMC - PubMed
    1. Begenisich T., Melvin J.E. Regulation of chloride channels in secretory epithelia. J. Membr. Biol. 1998;163:77–85. - PubMed
    1. Blatz A.L., Magleby K.L. Single chloride-selective channels active at membrane resting potentials in culture rat skeletal muscle. Biophys. J. 1985;47:119–123. - PMC - PubMed
    1. Bormann J., Hamill O.P., Sakmann B. Mechanism of anion permeation through channels gated by glycine and γ-aminobutyric acid in mouse cultured spinal neurones. J. Physiol. 1987;385:243–286. - PMC - PubMed

Publication types