. 2000 Dec 1;19(23):6536-45.
doi: 10.1093/emboj/19.23.6536.

A novel assembly mechanism for the DNA polymerase III holoenzyme DnaX complex: association of deltadelta' with DnaX(4) forms DnaX(3)deltadelta'

Affiliations

A novel assembly mechanism for the DNA polymerase III holoenzyme DnaX complex: association of deltadelta' with DnaX(4) forms DnaX(3)deltadelta'

A E Pritchard et al. EMBO J. .

Abstract

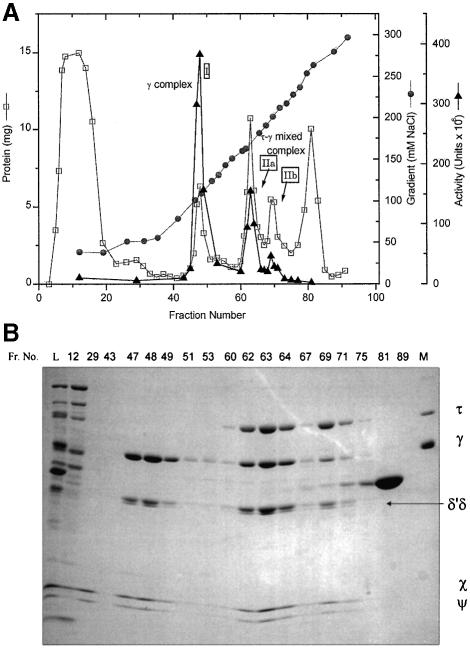
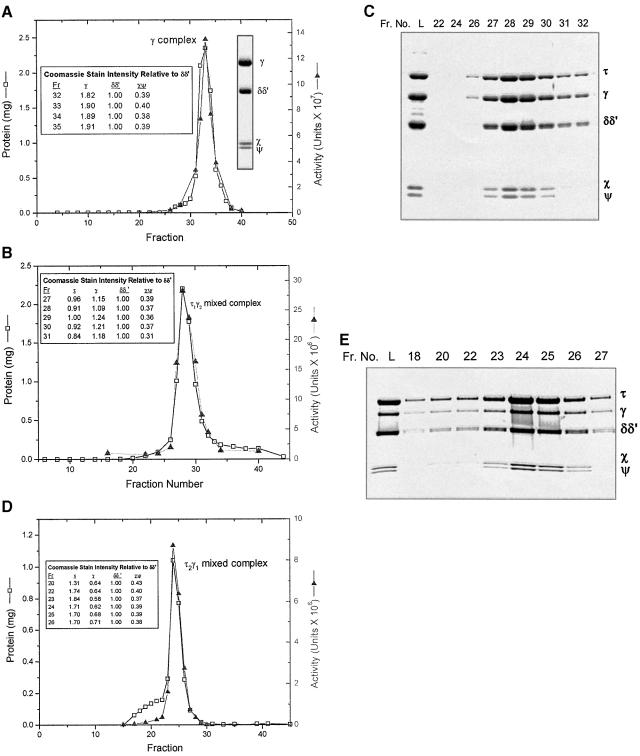
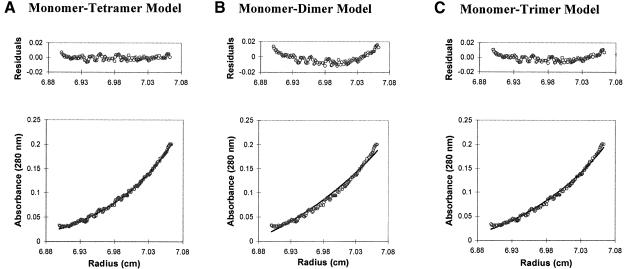
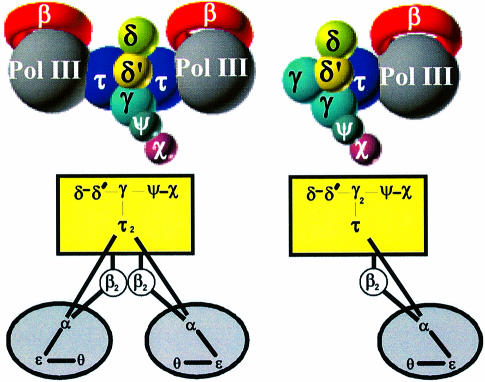
We have constructed a plasmid-borne artificial operon that expresses the six subunits of the DnaX complex of Escherichia coli DNA polymerase III holoenzyme: tau, gamma, delta, delta', chi and psi. Induction of this operon followed by assembly in vivo produced two taugamma mixed DnaX complexes with stoichiometries of tau(1)gamma(2)deltadelta'chipsi and tau(2)gamma(1)deltadelta'chipsi rather than the expected gamma(2)tau(2)deltadelta'chipsi. We observed the same heterogeneity when taugamma mixed DnaX complexes were reconstituted in vitro. Re-examination of homomeric DnaX tau and gamma complexes assembled either in vitro or in vivo also revealed a stoichiometry of DnaX(3)deltadelta'chipsi. Equilibrium sedimentation analysis showed that free DnaX is a tetramer in equilibrium with a free monomer. An assembly mechanism, in which the association of heterologous subunits with a homomeric complex alters the stoichiometry of the homomeric assembly, is without precedent. The significance of our findings to the architecture of the holoenzyme and the clamp-assembly apparatus of all other organisms is discussed.


Figures

None
Fig. 1. Purification of DnaX complexes expressed in MGC1030. (A) SP-Sepharose chromatography profile of a 185 ml column (32 × 2.5 cm) equilibrated with buffer T5 plus 20 mM NaCl that was loaded with the redissolved τγ mixed DnaX complex Fraction II ammonium sulfate pellet (Table I), which had been dissolved in buffer 25T5 so that the conductivity was equal to that of buffer T5 plus 20 mM NaCl. After a two-column volume wash, the complexes were eluted in 25 ml fractions with a 20–300 mM NaCl gradient (10 column vols) in buffer T5 at a flow rate of 0.6 column vols/h. Protein concentration (squares), conductivity (circles) and activity (triangles) are shown. The three activity peaks are labeled (I, IIa and IIb). (B) Gel electrophoresis of column fractions for the SP-Sepharose column shown in (A). Samples were electrophoresed on a 7.5–17.5% gradient SDS–polyacrylamide gel and stained with Coomassie Blue. Column fractions (30 µl each lane) are indicated above the gel (Fr. No.). L is the column load (25 µg). The positions of the DnaX complex subunits are marked. Lane M contains purified subunits used as markers.
None
Fig. 2. Purification of overexpressed DnaX complexes by Superose 6 gel filtration chromatography. (A) Fractions 47–49 (peak I, γ complex) from the SP-Sepharose column shown in Figure 1 were pooled and precipitated by adding an equal volume of saturated ammonium sulfate. The pellet was dissolved in 0.5 ml of buffer H/100, loaded onto the Superose 6 column, and eluted as 0.5 ml fractions at a flow rate of 0.25 column vols/h. The two insets show (left) quantification using Coomassie Blue stain intensity (not molar ratios since molar standards were not present on the gel) of subunits in selected fractions as determined from a gel scan, and (right) the protein from the peak fraction lane electrophoresed on an SDS–polyacrylamide gel. (B) Fractions 62–64 (peak IIa, τ1γ2 DnaX complex) from the SP-Sepharose column shown in Figure 1 were pooled and precipitated by adding an equal volume of saturated ammonium sulfate. One-half of the pellet was dissolved in 0.5 ml of buffer HM/100, loaded onto the Superose 6 column, and eluted as described in (A). The inset shows quantification using Coomassie Blue stain intensity (not molar ratios) of subunits in selected fractions as determined from a scan of the gel shown in (C). (C) Gel electrophoresis of column fractions for the Superose 6 column shown in (B). Samples (3.5 µl of each fraction) were electrophoresed as described in the legend to Figure 1B. Column fractions are indicated above the gel (Fr. No.). L is the column load. (D) Fractions equivalent to 70 and 71 (peak IIb, τ2γ1 DnaX complex) of the SP-Sepharose column shown in Figure 1 but from a separate, smaller column were pooled and precipitated by adding an equal volume of saturated ammonium sulfate. The pellet was redissolved, applied to the Superose 6 column, and eluted as described in (A) except that a different fraction collection apparatus was used and therefore the elution positions in (A), (B) and (D) are not directly comparable. The inset shows quantification using Coomassie Blue stain intensity (not molar ratios) of subunits in selected fractions as determined from a scan of a gel of the column fractions. (E) Gel electrophoresis of column fractions for the Superose 6 column shown in (D). Samples (8 µl of each fraction) were electrophoresed on a 4–20% gradient SDS–polyacrylamide gel. Column fractions are indicated above the gel (Fr. No.). L is the column load.
None
Fig. 3. MonoS chromatography of DnaX complexes assembled in vitro and in vivo. (A) Profile of a 1 ml MonoS-FPLC column equilibrated with buffer T5, plus 20 mM NaCl, plus 5 mM dithiothreitol (DTT), and loaded with 0.29 mg of a DnaX complex mixture assembled in vitro (see Materials and methods). After a 1 ml wash with the equilibration buffer, the protein was eluted in 0.25 ml fractions with a 20 column vol. 20–300 mM NaCl gradient in buffer T5 plus 5 mM DTT. The four activity peaks are labeled. (B) Column fraction samples (125 µl were trichloroacetic acid precipitated for each lane) were electrophoresed on a 10% SDS–polyacrylamide gel and stained with Coomassie Blue. Column fractions are indicated above the gel and L is the column load (8.8 µg). (C) MonoS column protein profile of DnaX complexes assembled in vitro (A) overlaid with that for a mixture of previously purified τ1γ2δδ′χψ (Figure 1A, peak IIa), τ2γ1δδ′χψ (Figure 1A, peak IIb) and τ complex (Pritchard et al., 1996). The alignment of the two profiles was determined from measured conductivities of the fractions.
None
Fig. 4. Sedimentation equilibrium ultracentrifugation of γ. Concentration distribution of γ at sedimentation equilibrium. Circles represent the actual data points for 6 µM γ (as monomer) centrifuged at 8000 r.p.m., and are identical for the three data graphs shown. The line in each data plot represents the theoretical fit to Equation 1 (Materials and methods) for the model indicated in each panel. The residual plot, expressed in absorbance units (280 nm), for each model is shown above the data plot. The sum-of-squares errors for the three models shown are 2.50 × 10⁻³, 6.11 × 10⁻³ and 4.04 × 10⁻³, respectively, and the root-mean-square errors are 1.66 × 10⁻³, 9.97 × 10⁻³ and 4.37 × 10⁻³, respectively. The best fit is the monomer–tetramer model. For the monomer–dimer–trimer, monomer–dimer–tetramer and monomer–tetramer–octamer models (not shown) the sum-of-squares errors are 4.01 × 10⁻³, 2.54 × 10⁻³ and 2.51 × 10⁻³, respectively, and the root-mean-square errors are 4.28 × 10⁻³, 1.71 × 10⁻³ and 1.67 × 10⁻³, respectively.
None
Fig. 5. Structural models of the DNA pol III holoenzyme. The two models are based on the two different τγ mixed DnaX complexes that were characterized in this study. Based on other evidence for the asymmetric dimer hypothesis (see text), the structure containing two polymerases is the preferred model for the replicase. The structure containing a single polymerase may have a function in mismatch repair.

Similar articles

Cited by

References

    1. Blinkowa A.L. and Walker,J.R. (1990) Programmed ribosomal frameshifting generates the Escherichia coli DNA polymerase III γ subunit from within the τ subunit reading frame. Nucleic Acids Res., 18, 1725–1729. - PMC - PubMed
    1. Cantor C.R. and Schimmel,P.R. (1980) Biophysical Chemistry Part I: The Conformation of Biological Macromolecules. W.H.Freeman, New York, NY, p. 137.
    1. Carter J.R., Franden,M.A., Aebersold,R. and McHenry,C.S. (1993) Identification, isolation, and characterization of the structural gene encoding the δ′ subunit of Escherichia coli DNA polymerase III holoenzyme. J. Bacteriol., 175, 3812–3822. - PMC - PubMed
    1. Dallmann H.G. and McHenry,C.S. (1995) DnaX complex of Escherichia coli DNA polymerase III holoenzyme. Physical characterization of the DnaX subunits and complexes. J. Biol. Chem., 270, 29563–29569. - PubMed
    1. Dallmann H.G., Thimmig,R.L. and McHenry,C.S. (1995) DnaX complex of Escherichia coli DNA polymerase III holoenzyme. Central role of τ in initiation complex assembly and in determining the functional asymmetry of holoenzyme. J. Biol. Chem., 270, 29555–29562. - PubMed

Publication types

MeSH terms