. 2000 Dec 1;529 Pt 2(Pt 2):295-306.
doi: 10.1111/j.1469-7793.2000.00295.x.

Voltage-dependent conductance changes in the store-operated Ca2+ current ICRAC in rat basophilic leukaemia cells

Affiliations

Voltage-dependent conductance changes in the store-operated Ca2+ current ICRAC in rat basophilic leukaemia cells

D Bakowski et al. J Physiol. .

Abstract

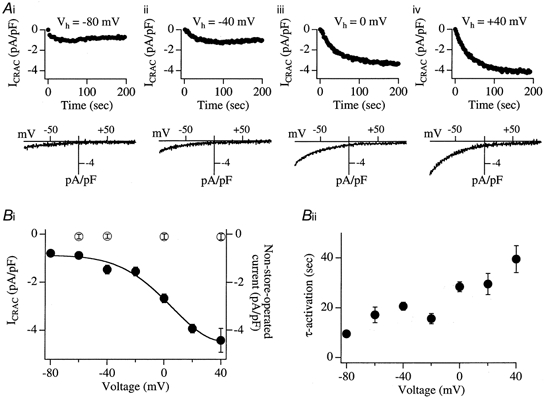
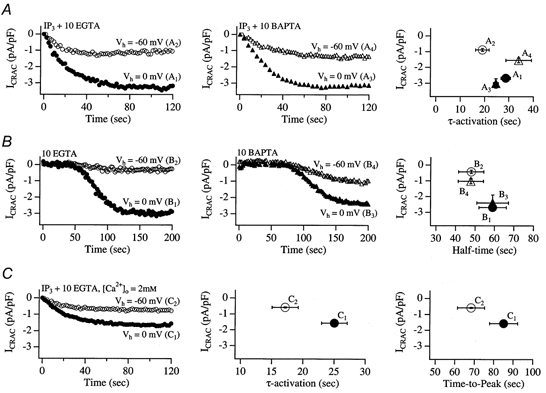
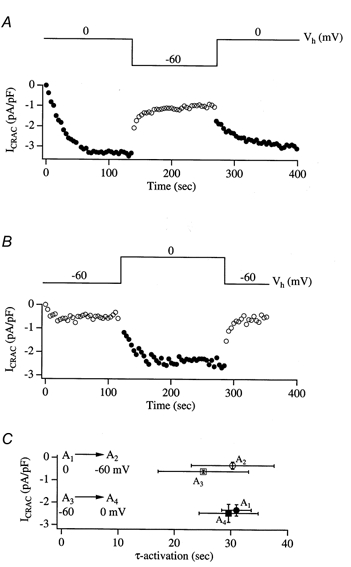
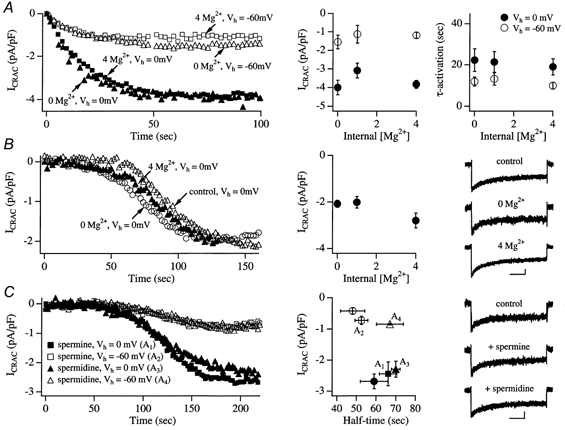
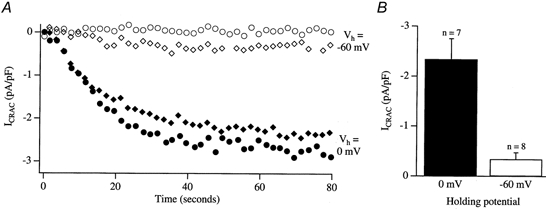
Tight-seal whole-cell patch-clamp experiments were carried out in order to investigate the effects of different holding potentials on the rate of development and amplitude of the Ca2+ release-activated Ca2+ current ICRAC in rat basophilic leukaemia (RBL-1) cells. ICRAC was monitored at -80 mV from fast voltage ramps, spanning 200 mV in 50 ms. At hyperpolarised potentials, the macroscopic CRAC conductance was lower than that seen at depolarised potentials. The conductance increased almost 5-fold over the voltage range -60 to +40 mV and was seen when the stores were depleted either by the combination of IP3 and thapsigargin in high Ca2+ buffer, or passively with 10 mM EGTA or BAPTA. The voltage-dependent conductance of the CRAC channels could not be fully accounted for by Ca2+-dependent fast inactivation, nor by other slower inhibitory mechanisms. It also did not seem to involve intracellular Mg2+ or the polycations spermine and spermidine. Voltage step relaxation experiments revealed that the voltage-dependent conductance changes developed and reversed slowly, with a time constant of several seconds at -60 mV. In the presence of physiological levels of intracellular Ca2+ buffers, ICRAC was barely detectable when cells were clamped at -60 mV and dialysed with IP3 and thapsigargin, but at 0 mV the current in low Ca2+ buffer was as large as that seen in high Ca2+ buffer. Our results suggest that CRAC channels exhibit slow voltage-dependent conductance changes which can triple the current amplitude over the physiological range of voltages normally encountered by these cells. The role of this conductance change and possible underlying mechanisms are discussed.


Figures

Figure 1
Figure 1. Conductance of CRAC channels depends on the holding potential
A, cells were clamped at the indicated holding potentials (Vh; −80 mV in i, −40 mV in ii, 0 mV in iii and +40 mV in iv). ICRAC was activated by dialysing cells with IP3 (30 μm), 10 mm EGTA and 2 μm thapsigargin and was monitored by applying fast voltage ramps (−100 to +100 mV in 50 ms at 0.5 Hz) superimposed on the holding potential. The amplitude of the current was always measured at −80 mV from the ramps. Upper panels plot the amplitude of ICRAC against time for each Vh (corresponding to different cells) and the lower panels show the I-V relationship obtained from the ramps. Bi, plot of the pooled data for ICRAC (•) from several cells for each Vh. Each point represents data from between 5 and 35 cells. The relationship between current amplitude and holding potential could be reasonably well fitted with a modified Boltzmann-type equation of the form: ICRAC (−80 mV) = 1/(1 + exp(VV½)/S) where V½ is the voltage at which the current is one-half its maximal amplitude and S is the slope factor (RT/zF), where R, T and F have their usual meanings and z is the gating valency of the voltage-dependent step. For the pooled data, V½ was −3.1 mV and z was 1.9. This is a macroscopic empirical estimate of z and is only a very rough indication. All points were significantly different from that at 0 mV (P < 0.05). The size of the non-store-operated current as a function of different holding potentials, measured for up to 300 s is also shown (^). For these recordings, cells were dialysed with a solution lacking IP3 and Ca2+ was buffered at 120 nm (see text). Note that this current is constant, irrespective of the membrane potential, and very small. It would therefore not affect the voltage dependence of ICRAC (•). Bii, summary of the relationship between holding potential and the time constant of activation (τ-activation). There was a tendency for the current to activate more quickly as the holding potential became more negative. τ-activation at −80, −60, −40 and −20 mV was significantly different from that at 0 mV, whereas τ-activation at +20 and +40 mV was not.
Figure 2
Figure 2. Reduction in the extent of fast Ca2+-dependent inactivation does not prevent HII of ICRAC
In A, the rate and extent of activation of ICRAC at 0 and −60 mV holding potentials with IP3+ EGTA + thapsigargin in the pipette are compared with those seen with IP3+ BAPTA + thapsigargin. Both chelators were used at 10 mm. A1 refers to IP3+ 10 mm EGTA + thapsigargin at a Vh of 0 mV, A2 to IP3+ 10 mm EGTA + thapsigargin at a Vh of −60 mV, A3 to IP3+ 10 mm BAPTA + thapsigargin at a Vh of 0 mV and A4 to IP3+ 10 mm BAPTA + thapsigargin at a Vh of −60 mV. Each trace is from a different cell. Pooled data are summarised in the right-hand panel, which plots current amplitude against τ-activation. Each point represents data from 5–9 cells. In B, ICRAC was activated passively following dialysis with 10 mm EGTA or BAPTA at the indicated holding potentials. IP3 was not present in the patch pipette. Point B1 here refers to 10 mm EGTA at a Vh of 0 mV, B2 to 10 mm EGTA at a Vh of −60 mV, B3 to 10 mm BAPTA at a Vh of 0 mV and B4 to 10 mm BAPTA at a Vh of −60 mV. The right-hand panel plots the amplitude of ICRAC against half-time to peak (time at which ICRAC had reached half its steady-state amplitude) and this has been corrected for the delay before the current started to develop (typically around 70 s). In C, ICRAC was activated by dialysing cells with IP3 and 10 mm EGTA + thapsigargin under conditions where extracellular Ca2+ was reduced from 10 to 2 mm. Point C1 refers to a Vh of 0 mV and C2 to a Vh of −60 mV.
Figure 4
Figure 4. Voltage step relaxation studies reveal that the development of, and recovery from, HII is slow
A, a cell was dialysed with IP3+ 10 mm EGTA + thapsigargin and held at 0 mV. Once ICRAC had reached steady state (•), the potential was changed to −60 mV. ICRAC then decayed slowly to reach a new steady-state (^). Stepping back to 0 mV resulted in a mono-exponential increase in the current (•) which almost reached the level it had prior to pulsing to −60 mV. B, similar experiment to A in a different cell which was initially held at −60 mV (^) and then stepped to 0 mV (•). In C, the amplitude of ICRAC is plotted against the activation time constant corresponding to each change in membrane potential. A1 represents the size of the current and τ-activation when cells were held at 0 mV upon break-in. A2 refers to the change in A1 upon stepping to −60 mV. A3 reflects the amplitude of ICRAC and τ-activation when cells were held at −60 mV upon break-in and A4 is the subsequent change when these cells were then stepped to 0 mV. Note that A1 and A4 are virtually identical, and A2 and A3 are not significantly different, indicating that the changes in ICRAC following each voltage relaxation do not seem to depend on the preceding state. Voltage relaxation experiments in the absence of store depletion (dialysis with an internal solution without IP3 and in which Ca2+ was strongly buffered at 120 nm to prevent passive store emptying) failed to generate slowly developing currents on stepping from 0 to −60 mV and vice versa. Instead, there was an instantaneous change in the current amplitude (< 10 pA). It is unlikely therefore that there was a major contribution from other conductances, including Na+-Ca2+ exchange, to the voltage relaxation experiments.
Figure 3
Figure 3. HII of CRAC channels is not mediated by cytoplasmic Mg2+ or polycations
A, cells were dialysed with IP3+ 10 mm EGTA + thapsigargin and the indicated concentrations of Mg2+. 0 Mg2+ refers to a pipette solution in which Mg2+ was omitted and 2 mm EDTA was added together with 10 mm EGTA. The left-hand panel shows examples of recordings from cells dialysed with 0 or 4 mm Mg2+ at a holding potential of either 0 mV (filled symbols) or −60 mV (corresponding open symbols). The middle and right-hand panels show how the amplitude of ICRAC and activation time constant are related to internal Mg2+ concentration. B shows the effects of the different Mg2+ concentrations on the properties of ICRAC when the latter was evoked by passive depletion of stores (10 mm EGTA). The left-hand panel depicts data from 3 cells dialysed with 0, 1 (control) or 4 mm Mg2+ at a holding potential of 0 mV and the middle panel shows the relationship between Mg2+ concentration and current size following passive store depletion. Each point represents data from 3–6 cells. The right-hand panel shows that fast Ca2+-dependent inactivation is not affected by changes in intracellular Mg2+ levels. Cells were held at 0 mV and then stepped to −80 mV for 250 s. Scale bars refer to 50 ms and −0.5 pA pF−1. In C, ICRAC was activated following dialysis with 10 mm EGTA and 2 mm spermine or spermidine and cells were clamped at either 0 or −60 mV. The left-hand panel depicts examples of the development of ICRAC in the presence of spermine (at either 0 (A1) or −60 mV (A2)) and spermidine (A3 at 0 and A4 at −60 mV). Data from 2 different cells are shown for each voltage. The middle graph plots the amplitude of ICRAC against half-time (time at which ICRAC had reached half its steady-state amplitude) for the different conditions. Filled circles represent the control (no polycation) at 0 mV and open circles correspond to the control at −60 mV. The right-hand panel shows that fast inactivation of ICRAC is largely unaffected by the polycations compared with control upon pulsing to −80 mV. Scale bars as in B.
Figure 5
Figure 5. ICRAC in low intracellular Ca2+ buffer is very small at a holding potential of −60 mV
A shows the time course of ICRAC for 2 cells held at 0 mV (filled symbols) and for 2 different cells held at −60 mV (open symbols). Internal solution contained IP3+ 0.1 mm EGTA + 2 μm thapsigargin. Note that one of the cells held at −60 mV did not generate ICRAC at all. In B, the amplitude histogram compares the size of ICRAC in low Ca2+ buffer for the 2 different holding potentials. At a Vh of 0 mV, ICRAC was around 5-fold larger than at a Vh of −60 mV.
Scheme 1
Scheme 1

References

    1. Artalejo AR, Ellory JC, Parekh AB. Ca2+-dependent capacitance increases in rat basophilic leukaemia cells following activation of store-operated Ca2+ entry and dialysis with high Ca2+-containing intracellular solution. Pflügers Archiv. 1998;436:934–939. - PubMed
    1. Berridge MJ. Capacitative Ca2+ entry. Biochemical Journal. 1995;312:1–11. - PMC - PubMed
    1. Fernandez J, Lindau M. A patch-clamp study of histamine-secreting cells. Journal of General Physiology. 1986;88:349–368. - PMC - PubMed
    1. Ficker E, Taglialatela M, Wible MA, Henley CM, Brown AM. Spermine and spermidine as gating molecules for inward rectifier K+ channels. Science. 1994;266:1068–1072. - PubMed
    1. Fierro L, Parekh AB. Fast calcium-dependent inactivation of calcium release-activated calcium current (CRAC) in Rbl-1 cells. Journal of Membrane Biology. 1999a;168:9–17. - PubMed

Publication types

LinkOut - more resources