. 2000 Dec 1;529 Pt 2(Pt 2):385-94.
doi: 10.1111/j.1469-7793.2000.00385.x.

Differential expression of volume-regulated anion channels during cell cycle progression of human cervical cancer cells

Affiliations

Differential expression of volume-regulated anion channels during cell cycle progression of human cervical cancer cells

M R Shen et al. J Physiol. .

Abstract

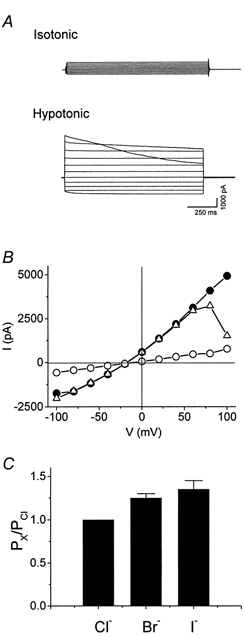
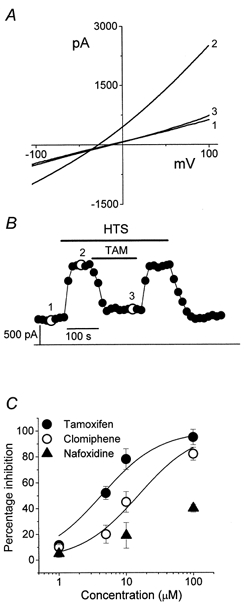
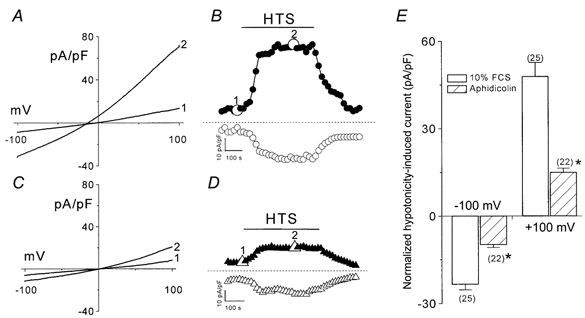
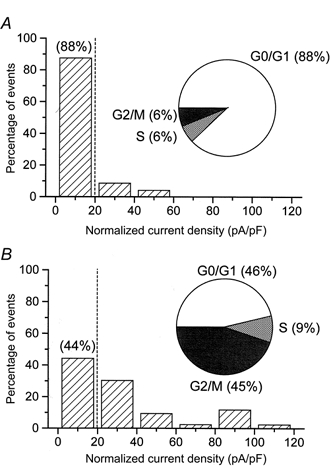
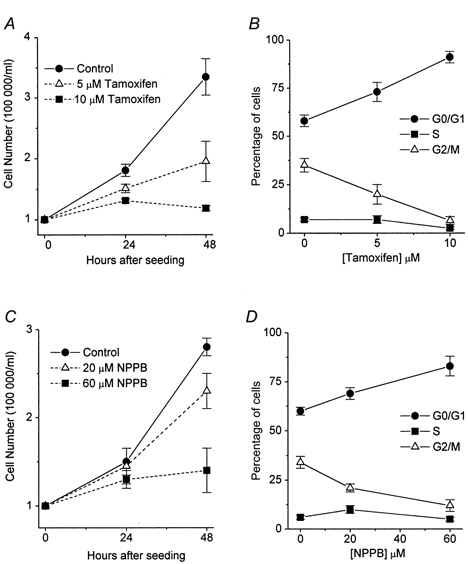
This study investigated the volume-regulated anion channel (VRAC) of human cervical cancer SiHa cells under various culture conditions, testing the hypothesis that the progression of the cell cycle is accompanied by differential expression of VRAC activity. Exponentially growing SiHa cells expressed VRACs, as indicated by the presence of large outwardly rectifying currents activated by hypotonic stress with the anion permeability sequence I- > Br- > Cl-. VRACs were potently inhibited by tamoxifen with an IC50 of 4.6 [mu]M. Fluorescence-activated cell sorting (FACS) experiments showed that 59 +/- 0.5, 5 +/- 0.5 and 36 +/- 1.1% of unsynchronized, exponentially growing cervical cancer SiHa cells were in G0/G1, S and G2/M stage, respectively. Treatment with aphidicolin (5 [mu]M) arrested 88 +/- 1.4% of cells at the G0/G1 stage. Arrest of cell growth in the G0/G1 phase was accompanied by a significant decrease of VRAC activity. The normalized hypotonicity-induced current decreased from 48 +/- 5.2 pA pF-1 at +100 mV in unsynchronized cells to 15 +/- 2.6 pA pF-1 at +100 mV in aphidicolin-treated cells. After removal of aphidicolin, culturing in medium containing 10% fetal calf serum triggered a rapid re-entry into the cell cycle and a concomitant recovery of VRAC density. Pharmacological blockade of VRACs by tamoxifen or NPPB caused proliferating cervical cancer cells to arrest in the G0/G1 stage, suggesting that activity of this channel is critical for G1/S checkpoint progression. This study provides new information on the functional significance of VRACs in the cell cycle clock of human cervical cancer cells.


Figures

Figure 1
Figure 1. Volume-activated currents in SiHa cervical cancer cells
A, current traces (step protocol) were recorded in isotonic and hypotonic solutions. Horizontal lines either side of the traces represent the zero current level. B, current-voltage relationships obtained from traces in A. • and ▵, hypotonicity-induced current at the beginning and end of the voltage pulse, respectively; ^, current in isotonic solution. C, anion permeability of volume-activated currents. The anion permeability relative to that of Cl (PX/PCl) was calculated from the shift in reversal potential as described in Methods. Each bar represents the mean ±s.e.m. (n = 5).
Figure 2
Figure 2. Effect of non-steroidal oestrogen antagonists on the volume-regulated Cl currents of human cervical cancer SiHa cells
A, representative recordings of volume-regulated Cl currents from the ramp protocol. Trace 1, basal membrane current recorded in isotonic solution; traces 2 and 3, currents recorded after perfusion with hypotonic solution in the absence or presence of 10 μm tamoxifen, respectively. B, time course of membrane currents activated at +100 mV. Data points were obtained from the voltage ramp protocol, which was applied every 15 s. The numbered points correspond to the current traces recorded in A. Horizontal bars indicate application of hypotonic solution (HTS) or 10 μm tamoxifen (TAM). Horizontal line, zero current level. C, dose-response curves for the inhibition of the volume-regulated Cl currents by non-steroidal oestrogen antagonists, measured at +100 mV. Each point represents the mean ±s.e.m. (n = 4).
Figure 3
Figure 3. Downregulation of volume-regulated Cl current in growth-arrested cells
A and C, representative recordings of volume-regulated Cl currents of SiHa cervical cancer cells during unsynchronized, exponential growth (A) and growth arrest by aphidicolin (C) from the ramp protocol. Trace 1, basal membrane current recorded in isotonic solution; trace 2, currents recorded after perfusion with hypotonic solution. B and D, time course of membrane currents activated at +100 mV (filled symbols) or −100 mV (open symbols). Data points were obtained from the voltage ramp protocol, which was applied every 15 s. The numbered points in B and D correspond to the current traces recorded in A and C, respectively. Horizontal bars indicate application of hypotonic solution (HTS). Horizontal line, zero current level. E, normalized currents activated by hypotonicity measured at −100 or +100 mV in synchronized or unsynchronized SiHa cells. The number of cells examined is indicated in parentheses beside each bar. 10% FCS, unsynchronized cells cultured with 10% fetal calf serum. Aphidicolin, cell synchronization in G0/G1 phase by incubation with 5 μm aphidicolin. *P < 0.0001 by unpaired t test.
Figure 4
Figure 4. Recovery of activity of volume-regulated Cl current following cell cycle re-entry
Distribution of normalized currents activated by hypotonicity measured at +100 mV in synchronized cells (A) or in cells re-entering the cell cycle (B). The histograms were constructed with a bin width of 20 pA pF−1 and the inset shows the distribution of cells within the cell cycle, measured in parallel experiments by FACS. The vertical dashed line is the cut-off point for convenience of comparison. The cell numbers in A and B are 25 and 43, respectively.
Figure 5
Figure 5. Blockade of volume-regulated Cl current by tamoxifen and NPPB induces growth arrest of proliferating SiHa cervical cancer cells in G0/G1 phase
A and C, inhibition of the proliferation of SiHa cells by tamoxifen and NPPB. Cell were seeded at a density of 1 × 10⁵ ml−1, and counted 24 and 48 h after incubation with various concentrations of tamoxifen or NPPB. B and D, the simultaneous FACS measurement for the distribution of cells in the different cell cycle phases (G0/G1, S and G2/M) after 48 h incubation with various concentrations of tamoxifen or NPPB. Each point in the curves represents the mean ±s.e.m. (n = 3).

References

    1. Bubien JK, Kirk LK, Rado TA, Frizzell RA. Cell cycle dependence of chloride permeability in normal and cystic fibrosis lymphocytes. Science. 1990;248:1416–1419. - PubMed
    1. Chou CY, Shen MR, Chen TM, Huang KE. Volume-activated taurine transport is differentially activated in human cervical cancer HT-3 cells, but not activated in HPV-immortalized Z 183A and normal cervical epithelial cells. Clinical and Experimental Pharmacology and Physiology. 1997;24:935–939. - PubMed
    1. Chou CY, Shen MR, Hsu KS, Huang HY, Lin HC. Involvement of PKC-α in regulatory volume decrease responses and activation of volume-sensitive chloride channels in human cervical cancer HT-3 cells. Journal of Physiology. 1998;512:435–448. - PMC - PubMed
    1. Chou CY, Shen MR, Wu SN. Volume-sensitive chloride channels associated with human cervical carcinogenesis. Cancer Research. 1995;55:6077–6083. - PubMed
    1. DeCoursey TE, Chandy G, Gupta S, Cahalan MD. Voltage-gated K+ channels in human T lymphocytes: a role in mitogenesis? Nature. 1984;307:465–468. - PubMed

Publication types